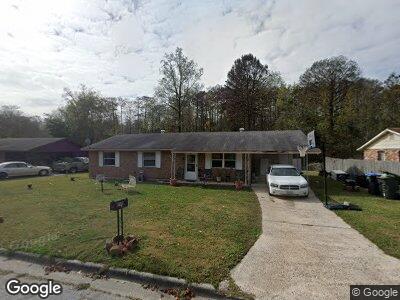
2616 Brookshire Rd Augusta, GA 30906
Meadowbrook NeighborhoodEstimated Value: $123,000 - $150,000
3
Beds
2
Baths
1,134
Sq Ft
$120/Sq Ft
Est. Value
About This Home
This home is located at 2616 Brookshire Rd, Augusta, GA 30906 and is currently estimated at $136,606, approximately $120 per square foot. 2616 Brookshire Rd is a home located in Richmond County with nearby schools including Meadowbrook Elementary School, Glenn Hills Middle School, and Johnson Magnet.
Ownership History
Date
Name
Owned For
Owner Type
Purchase Details
Closed on
Apr 1, 1979
Current Estimated Value
Purchase Details
Closed on
May 1, 1978
Create a Home Valuation Report for This Property
The Home Valuation Report is an in-depth analysis detailing your home's value as well as a comparison with similar homes in the area
Home Values in the Area
Average Home Value in this Area
Tax History Compared to Growth
Tax History
| Year | Tax Paid | Tax Assessment Tax Assessment Total Assessment is a certain percentage of the fair market value that is determined by local assessors to be the total taxable value of land and additions on the property. | Land | Improvement |
|---|---|---|---|---|
| 2024 | $1,374 | $36,260 | $4,000 | $32,260 |
| 2023 | $1,374 | $39,328 | $4,000 | $35,328 |
| 2022 | $1,133 | $26,340 | $4,000 | $22,340 |
| 2021 | $1,010 | $19,995 | $4,000 | $15,995 |
| 2020 | $1,138 | $24,609 | $4,000 | $20,609 |
| 2019 | $1,192 | $24,609 | $4,000 | $20,609 |
| 2018 | $1,198 | $24,609 | $4,000 | $20,609 |
| 2017 | $1,146 | $24,609 | $4,000 | $20,609 |
| 2016 | $1,147 | $24,609 | $4,000 | $20,609 |
| 2015 | $1,154 | $24,609 | $4,000 | $20,609 |
| 2014 | $1,155 | $24,609 | $4,000 | $20,609 |
Source: Public Records
Map
Nearby Homes
- 3614 Melbourne Dr
- 2525 Meadowbrook Dr
- 3618 Lofwood Dr
- 3522 Bullock Ave
- 3539 Redd Dr
- 3505 Prince Rd
- 2604 Surry St
- 2911A Meadowbrook Dr
- 3504 Dayton St
- 2245 Archer Ln
- 2243 Archer Ln
- 2241 Archer Ln
- 3602 Kinglet Ct
- 3529 Evangeline Dr
- 2920 Meadowbrook Dr
- 3575 Woodlake Rd
- 2380 Winston Way
- 2430 Winston Way
- 3619 Audubon Place
- 3628 Larkspur Dr