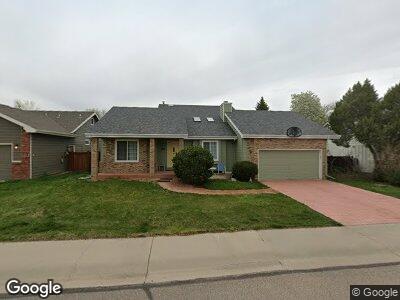
2624 Hollingbourne Dr Fort Collins, CO 80526
Fairbrooke NeighborhoodEstimated Value: $564,574 - $627,000
3
Beds
2
Baths
1,861
Sq Ft
$320/Sq Ft
Est. Value
About This Home
This home is located at 2624 Hollingbourne Dr, Fort Collins, CO 80526 and is currently estimated at $594,644, approximately $319 per square foot. 2624 Hollingbourne Dr is a home located in Larimer County with nearby schools including Bauder Elementary School, Blevins Middle School, and Rocky Mountain High School.
Ownership History
Date
Name
Owned For
Owner Type
Purchase Details
Closed on
Apr 15, 2003
Sold by
Bernard John F and Bernard Deborah L
Bought by
Hall Joseph T and Hall Linda R
Current Estimated Value
Home Financials for this Owner
Home Financials are based on the most recent Mortgage that was taken out on this home.
Original Mortgage
$180,924
Outstanding Balance
$80,453
Interest Rate
5.64%
Mortgage Type
Unknown
Estimated Equity
$514,192
Purchase Details
Closed on
Aug 9, 1999
Sold by
Maryjane Schwab Glen I Thompson Schwab
Bought by
Bernard John F and Bernard Deborah L
Home Financials for this Owner
Home Financials are based on the most recent Mortgage that was taken out on this home.
Original Mortgage
$111,000
Interest Rate
7.63%
Purchase Details
Closed on
Apr 1, 1993
Sold by
Thompson Maryjane
Bought by
Schwab Glen I
Create a Home Valuation Report for This Property
The Home Valuation Report is an in-depth analysis detailing your home's value as well as a comparison with similar homes in the area
Home Values in the Area
Average Home Value in this Area
Purchase History
| Date | Buyer | Sale Price | Title Company |
|---|---|---|---|
| Hall Joseph T | $226,155 | Stewart Title | |
| Bernard John F | $171,000 | -- | |
| Schwab Glen I | -- | -- |
Source: Public Records
Mortgage History
| Date | Status | Borrower | Loan Amount |
|---|---|---|---|
| Open | Hall Linda R | $36,200 | |
| Open | Hall Joseph T | $180,924 | |
| Previous Owner | Bernard Deborah L | $109,336 | |
| Previous Owner | Bernard John F | $15,000 | |
| Previous Owner | Bernard John F | $111,000 |
Source: Public Records
Tax History Compared to Growth
Tax History
| Year | Tax Paid | Tax Assessment Tax Assessment Total Assessment is a certain percentage of the fair market value that is determined by local assessors to be the total taxable value of land and additions on the property. | Land | Improvement |
|---|---|---|---|---|
| 2025 | $2,618 | $39,061 | $3,015 | $36,046 |
| 2024 | $2,618 | $39,061 | $3,015 | $36,046 |
| 2022 | $2,112 | $29,316 | $3,128 | $26,188 |
| 2021 | $2,134 | $30,159 | $3,218 | $26,941 |
| 2020 | $2,093 | $29,523 | $3,218 | $26,305 |
| 2019 | $2,102 | $29,523 | $3,218 | $26,305 |
| 2018 | $1,765 | $26,568 | $3,240 | $23,328 |
| 2017 | $1,759 | $26,568 | $3,240 | $23,328 |
| 2016 | $1,357 | $22,829 | $3,582 | $19,247 |
| 2015 | $1,348 | $22,830 | $3,580 | $19,250 |
| 2014 | $1,131 | $20,360 | $3,580 | $16,780 |
Source: Public Records
Map
Nearby Homes
- 2449 W Stuart St
- 2019 Tunis Cir
- 2406 Merino Ct
- 2043 White Rock Ct
- 2924 Ross Dr Unit H20
- 2409 Evergreen Dr
- 3024 Ross Dr Unit A3
- 1720 Azalea Ct
- 2814 Morgan Ct
- 3000 Ross Dr Unit F31
- 2131 Romney Ave
- 2930 W Stuart St Unit 27
- 2943 Rams Ln Unit C
- 2960 W Stuart St Unit A303
- 2960 W Stuart St Unit A302
- 3005 Ross Dr Unit U17
- 1733 Azalea Dr Unit 2
- 2950 Neil Dr Unit 14
- 1301 Ponderosa Dr
- 3029 Ross Dr Unit Y8