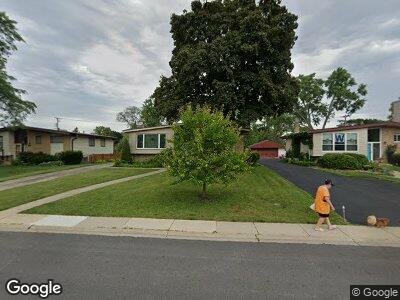
2626 Harrison St Glenview, IL 60025
Estimated Value: $464,308 - $580,000
3
Beds
3
Baths
1,447
Sq Ft
$366/Sq Ft
Est. Value
About This Home
This home is located at 2626 Harrison St, Glenview, IL 60025 and is currently estimated at $529,577, approximately $365 per square foot. 2626 Harrison St is a home located in Cook County with nearby schools including Washington Elementary School, Gemini Middle School, and Maine East High School.
Ownership History
Date
Name
Owned For
Owner Type
Purchase Details
Closed on
Mar 8, 2023
Sold by
Barash Galina
Bought by
Galina Barash Living Trust
Current Estimated Value
Purchase Details
Closed on
May 31, 2006
Sold by
Corrigan Mary E
Bought by
Barash Galina
Home Financials for this Owner
Home Financials are based on the most recent Mortgage that was taken out on this home.
Original Mortgage
$366,000
Interest Rate
5.87%
Mortgage Type
Unknown
Purchase Details
Closed on
Aug 31, 2005
Sold by
Wheeler Mary Kathleen and Corrigan Mary E
Bought by
Corrigan Mary E and The Mary E Corrigan Declaration Of Trust
Purchase Details
Closed on
Oct 31, 1994
Sold by
Cole Taylor Bank
Bought by
Corrigan James E and Corrigan Mary E
Create a Home Valuation Report for This Property
The Home Valuation Report is an in-depth analysis detailing your home's value as well as a comparison with similar homes in the area
Home Values in the Area
Average Home Value in this Area
Purchase History
| Date | Buyer | Sale Price | Title Company |
|---|---|---|---|
| Galina Barash Living Trust | -- | None Listed On Document | |
| Barash Galina | $466,000 | Ticor | |
| Corrigan Mary E | -- | -- | |
| Corrigan James E | -- | -- |
Source: Public Records
Mortgage History
| Date | Status | Borrower | Loan Amount |
|---|---|---|---|
| Previous Owner | Barash Galina | $322,000 | |
| Previous Owner | Barash Galina | $324,000 | |
| Previous Owner | Barash Galina | $341,000 | |
| Previous Owner | Barash Galina | $366,000 | |
| Previous Owner | Corrigan James E | $100,000 |
Source: Public Records
Tax History Compared to Growth
Tax History
| Year | Tax Paid | Tax Assessment Tax Assessment Total Assessment is a certain percentage of the fair market value that is determined by local assessors to be the total taxable value of land and additions on the property. | Land | Improvement |
|---|---|---|---|---|
| 2024 | $7,883 | $34,451 | $8,911 | $25,540 |
| 2023 | $7,883 | $36,680 | $8,911 | $27,769 |
| 2022 | $7,883 | $36,680 | $8,911 | $27,769 |
| 2021 | $5,987 | $24,552 | $7,638 | $16,914 |
| 2020 | $5,871 | $24,552 | $7,638 | $16,914 |
| 2019 | $6,671 | $31,079 | $7,638 | $23,441 |
| 2018 | $5,395 | $23,623 | $6,577 | $17,046 |
| 2017 | $6,180 | $27,095 | $6,577 | $20,518 |
| 2016 | $6,010 | $27,095 | $6,577 | $20,518 |
| 2015 | $6,131 | $25,543 | $5,516 | $20,027 |
| 2014 | $5,981 | $25,543 | $5,516 | $20,027 |
| 2013 | $5,847 | $25,543 | $5,516 | $20,027 |
Source: Public Records
Map
Nearby Homes
- 2708 Harrison St
- 212 Valerie Ct
- 2736 Helen Dr
- 517 Briarhill Ln
- 9508 Oliphant Ave
- 409 Warren Rd
- 8001 W Courte Dr Unit E307
- 834 Meadowlark Ln
- 8101 W Courte Dr Unit D405
- 418 Warren Rd
- 2801 Glenview Rd
- 2215 Henley St
- 528 Glendale Rd
- 616 Glendale Rd
- 3241 Ronald Rd
- 124 Lincoln St
- 416 Glendale Rd
- 324 Washington St
- 135 Lincoln St
- 2117 Henley St