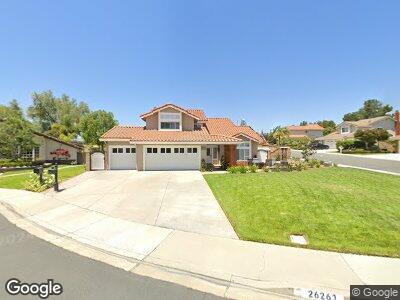
26261 Danby Way Lake Forest, CA 92630
Estimated Value: $1,579,676 - $1,801,000
4
Beds
3
Baths
2,509
Sq Ft
$668/Sq Ft
Est. Value
About This Home
This home is located at 26261 Danby Way, Lake Forest, CA 92630 and is currently estimated at $1,674,919, approximately $667 per square foot. 26261 Danby Way is a home located in Orange County with nearby schools including Lake Forest Elementary School, Serrano Intermediate School, and El Toro High School.
Ownership History
Date
Name
Owned For
Owner Type
Purchase Details
Closed on
Nov 4, 2020
Sold by
Chappell John M and Chappell Linda M
Bought by
Chappell John M and Chappell Linda M
Current Estimated Value
Home Financials for this Owner
Home Financials are based on the most recent Mortgage that was taken out on this home.
Original Mortgage
$252,688
Interest Rate
2.8%
Mortgage Type
New Conventional
Purchase Details
Closed on
May 3, 2011
Sold by
Chappell John M and Chappell Linda M
Bought by
Chappell John M and Chappell Linda M
Create a Home Valuation Report for This Property
The Home Valuation Report is an in-depth analysis detailing your home's value as well as a comparison with similar homes in the area
Home Values in the Area
Average Home Value in this Area
Purchase History
| Date | Buyer | Sale Price | Title Company |
|---|---|---|---|
| Chappell John M | -- | Wfg Title Company Of Ca | |
| Chappell John M | -- | Wfg National Title | |
| Chappell John M | -- | None Available |
Source: Public Records
Mortgage History
| Date | Status | Borrower | Loan Amount |
|---|---|---|---|
| Closed | Chappell John M | $252,688 | |
| Closed | Chappell John M | $100,000 | |
| Closed | Chappell John M | $310,000 | |
| Closed | Chappell John M | $100,000 | |
| Closed | Chappell John M | $28,000 | |
| Closed | Chappell John M | $18,000 | |
| Closed | Chappell John M | $322,700 | |
| Closed | Chappell John M | $100,000 | |
| Closed | Chappell John M | $220,000 |
Source: Public Records
Tax History Compared to Growth
Tax History
| Year | Tax Paid | Tax Assessment Tax Assessment Total Assessment is a certain percentage of the fair market value that is determined by local assessors to be the total taxable value of land and additions on the property. | Land | Improvement |
|---|---|---|---|---|
| 2024 | $4,468 | $436,116 | $128,116 | $308,000 |
| 2023 | $4,362 | $427,565 | $125,604 | $301,961 |
| 2022 | $4,283 | $419,182 | $123,141 | $296,041 |
| 2021 | $4,196 | $410,963 | $120,726 | $290,237 |
| 2020 | $4,158 | $406,750 | $119,489 | $287,261 |
| 2019 | $4,074 | $398,775 | $117,146 | $281,629 |
| 2018 | $3,996 | $390,956 | $114,849 | $276,107 |
| 2017 | $3,915 | $383,291 | $112,597 | $270,694 |
| 2016 | $3,849 | $375,776 | $110,389 | $265,387 |
| 2015 | $3,802 | $370,132 | $108,731 | $261,401 |
| 2014 | $3,718 | $362,882 | $106,601 | $256,281 |
Source: Public Records
Map
Nearby Homes
- 25912 Densmore Dr
- 21861 Montbury Dr
- 26411 Elmcrest Way
- 26368 Spring Creek Cir Unit 52
- 26091 Galway Dr
- 21575 Kenmare Dr
- 21702 Montbury Dr
- 22222 Newbridge Dr Unit 5
- 26022 Dundee Dr
- 21762 Exton Way
- 25761 Le Parc Unit 77
- 21681 Rushford Dr
- 25712 Le Parc Unit 96
- 25712 Le Parc Unit 21
- 25712 Le Parc Unit 32
- 25712 Le Parc Unit 57
- 25612 Ashby Way
- 25671 Le Parc Unit 93
- 302 Summit Crest Dr
- 25747 View Pointe Unit 7E