2633 Williams Dr Pleasant View, TN 37146
Pleasant View NeighborhoodEstimated Value: $539,180
--
Bed
1
Bath
1,400
Sq Ft
$385/Sq Ft
Est. Value
About This Home
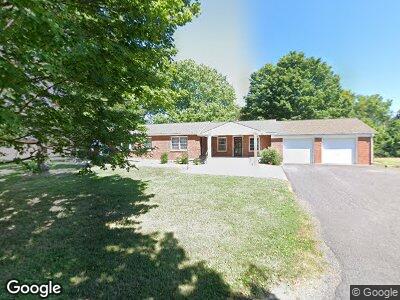
This home is located at 2633 Williams Dr, Pleasant View, TN 37146 and is currently estimated at $539,180, approximately $385 per square foot. 2633 Williams Dr is a home located in Cheatham County with nearby schools including Pleasant View Elementary School, Sycamore Middle School, and Sycamore High School.
Ownership History
Date
Name
Owned For
Owner Type
Purchase Details
Closed on
Feb 2, 2007
Sold by
Binkley Family Trust
Bought by
Demonbreun Danny R
Current Estimated Value
Purchase Details
Closed on
Feb 23, 1999
Sold by
Binkley Family Trust
Bought by
Gleaves Daniel G and Gleaves Susan M
Purchase Details
Closed on
Dec 16, 1997
Sold by
Binkley Robey L
Bought by
Binkley Nora V Of
Purchase Details
Closed on
Mar 25, 1961
Bought by
Binkley Robey L and Binkley Nora
Create a Home Valuation Report for This Property
The Home Valuation Report is an in-depth analysis detailing your home's value as well as a comparison with similar homes in the area
Home Values in the Area
Average Home Value in this Area
Purchase History
| Date | Buyer | Sale Price | Title Company |
|---|---|---|---|
| Demonbreun Danny R | $220,000 | -- | |
| Gleaves Daniel G | $21,000 | -- | |
| Binkley Nora V Of | -- | -- | |
| Binkley Robey L | -- | -- |
Source: Public Records
Mortgage History
| Date | Status | Borrower | Loan Amount |
|---|---|---|---|
| Open | Marose Kyle | $100,000 | |
| Closed | Demonbreun Danny R | $100,000 |
Source: Public Records
Tax History Compared to Growth
Tax History
| Year | Tax Paid | Tax Assessment Tax Assessment Total Assessment is a certain percentage of the fair market value that is determined by local assessors to be the total taxable value of land and additions on the property. | Land | Improvement |
|---|---|---|---|---|
| 2024 | $1,928 | $121,160 | $33,160 | $88,000 |
| 2023 | $2,208 | $85,000 | $22,040 | $62,960 |
| 2022 | $2,105 | $85,000 | $22,040 | $62,960 |
| 2021 | $2,105 | $85,000 | $22,040 | $62,960 |
| 2020 | $2,105 | $85,000 | $22,040 | $62,960 |
| 2019 | $2,105 | $85,000 | $22,040 | $62,960 |
| 2018 | $2,411 | $82,360 | $21,000 | $61,360 |
| 2017 | $2,271 | $82,360 | $21,000 | $61,360 |
| 2016 | $2,152 | $82,360 | $21,000 | $61,360 |
| 2015 | $2,290 | $82,360 | $21,000 | $61,360 |
| 2014 | $2,290 | $82,360 | $21,000 | $61,360 |
Source: Public Records
Map
Nearby Homes
- 2305 Bradley St
- 102 Josie Dr
- 251 Jesse Dr
- 173 Jesse Dr
- 2507 Pleasant View Rd
- 7316 Winding Way
- 2126 Old Chamblis Rd
- 499 Preakness Cir
- 4100 Meadow View Cir
- 160 Majestic Ln
- 2468 Pleasant View Rd
- 2290 Jack Teasley Rd
- 140 Pocono Dr
- 2302 Jack Teasley Rd
- 5025 Highpoint Rd
- 124 Savannah Ave
- 136 Savannah Ave
- 102 Highland Reserves
- 2454 Pleasant View Rd
- 180 Young Ln