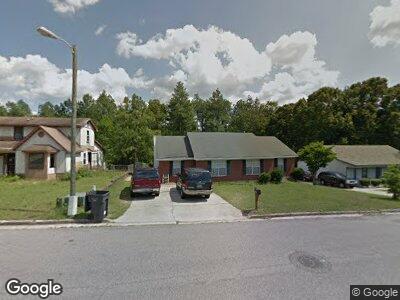
2654 Barclay St Hephzibah, GA 30815
Windsor Spring NeighborhoodEstimated Value: $190,000 - $206,167
3
Beds
2
Baths
1,814
Sq Ft
$111/Sq Ft
Est. Value
About This Home
This home is located at 2654 Barclay St, Hephzibah, GA 30815 and is currently estimated at $200,542, approximately $110 per square foot. 2654 Barclay St is a home located in Richmond County with nearby schools including Jamestown Elementary School, Glenn Hills Middle School, and Johnson Magnet.
Ownership History
Date
Name
Owned For
Owner Type
Purchase Details
Closed on
Apr 7, 2005
Sold by
Bell Gaymon Hepler Rutha Mae Bell and Bell Gaymon Rutha Mae
Bought by
Gaymon Hepler Rutha Mae Bell
Current Estimated Value
Home Financials for this Owner
Home Financials are based on the most recent Mortgage that was taken out on this home.
Original Mortgage
$68,000
Outstanding Balance
$966
Interest Rate
5.99%
Mortgage Type
Stand Alone Refi Refinance Of Original Loan
Estimated Equity
$200,414
Purchase Details
Closed on
Nov 29, 1993
Sold by
Gaymon Dominic Curt
Bought by
Gaymon Rutha Mae Be
Purchase Details
Closed on
Apr 1, 1991
Sold by
Singleton C J
Bought by
Gaymon Rutha B
Purchase Details
Closed on
Oct 25, 1990
Sold by
First Union Mortgag
Bought by
Singleton C J
Purchase Details
Closed on
May 1, 1988
Sold by
Greene Roger By Att
Bought by
First Union Mortgag
Create a Home Valuation Report for This Property
The Home Valuation Report is an in-depth analysis detailing your home's value as well as a comparison with similar homes in the area
Home Values in the Area
Average Home Value in this Area
Purchase History
| Date | Buyer | Sale Price | Title Company |
|---|---|---|---|
| Gaymon Hepler Rutha Mae Bell | -- | -- | |
| Gaymon Rutha Mae Be | -- | -- | |
| Gaymon Rutha B | $74,900 | -- | |
| Singleton C J | $8,000 | -- |
Source: Public Records
Mortgage History
| Date | Status | Borrower | Loan Amount |
|---|---|---|---|
| Closed | Gaymon Hepler Rutha Mae Bell | $68,000 | |
| Closed | Gaymon Rutha Mae Bell | $38,000 |
Source: Public Records
Tax History Compared to Growth
Tax History
| Year | Tax Paid | Tax Assessment Tax Assessment Total Assessment is a certain percentage of the fair market value that is determined by local assessors to be the total taxable value of land and additions on the property. | Land | Improvement |
|---|---|---|---|---|
| 2024 | $2,410 | $75,036 | $6,480 | $68,556 |
| 2023 | $2,410 | $75,556 | $6,480 | $69,076 |
| 2022 | $2,112 | $61,298 | $6,480 | $54,818 |
| 2021 | $1,557 | $37,780 | $6,480 | $31,300 |
| 2020 | $1,535 | $37,780 | $6,480 | $31,300 |
| 2019 | $1,618 | $37,780 | $6,480 | $31,300 |
| 2018 | $1,628 | $37,780 | $6,480 | $31,300 |
| 2017 | $1,584 | $37,780 | $6,480 | $31,300 |
| 2016 | $1,585 | $37,780 | $6,480 | $31,300 |
| 2015 | $1,595 | $37,780 | $6,480 | $31,300 |
| 2014 | $1,597 | $37,780 | $6,480 | $31,300 |
Source: Public Records
Map
Nearby Homes
- 2620 Claymont Rd
- 2615 Claymont Rd
- 3605 Hill Top Ct
- 3511 Becton Rd
- 2676 Crosscreek Rd
- 2669 Corning St
- 2713 Castletown Dr
- 2630 Portsmouth Place
- 3575 Woodlake Rd
- 1505 Oglethorpe Dr
- 2560 Granda Place
- 2659 Cranbrook Dr
- 3608 San Sebastian Dr
- 3606 Spanish Trace Dr
- 3504 Snowden Dr
- 3504 Dayton St
- 3697 Woodcock Dr
- 3635 Spanish Trace Dr
- 2564 Andorra Dr
- 4325 Newland St