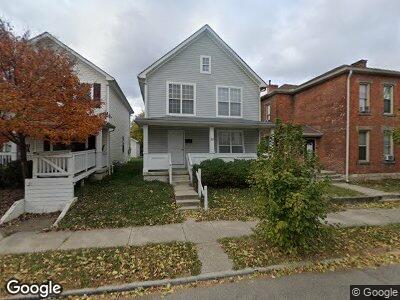
269 S Skidmore St Columbus, OH 43215
East Franklinton NeighborhoodEstimated Value: $263,271 - $352,000
4
Beds
2
Baths
1,488
Sq Ft
$197/Sq Ft
Est. Value
About This Home
This home is located at 269 S Skidmore St, Columbus, OH 43215 and is currently estimated at $292,818, approximately $196 per square foot. 269 S Skidmore St is a home located in Franklin County with nearby schools including Sullivant Elementary School, Starling PK-8, and West High School.
Ownership History
Date
Name
Owned For
Owner Type
Purchase Details
Closed on
Jul 22, 2009
Sold by
Simple Real Estate Llc
Bought by
City County Holding Inc
Current Estimated Value
Home Financials for this Owner
Home Financials are based on the most recent Mortgage that was taken out on this home.
Original Mortgage
$250,000
Interest Rate
5.27%
Mortgage Type
Future Advance Clause Open End Mortgage
Purchase Details
Closed on
Sep 8, 2006
Sold by
Blue Grass Properties Llc
Bought by
City View Homes Llc
Purchase Details
Closed on
Oct 18, 2004
Sold by
Bechtel Becky and Bechtel Larry F
Bought by
Blue Grass Properties Llc
Purchase Details
Closed on
Feb 21, 1986
Bought by
Tyler George W
Create a Home Valuation Report for This Property
The Home Valuation Report is an in-depth analysis detailing your home's value as well as a comparison with similar homes in the area
Home Values in the Area
Average Home Value in this Area
Purchase History
| Date | Buyer | Sale Price | Title Company |
|---|---|---|---|
| City County Holding Inc | $19,000 | Attorney | |
| City View Homes Llc | $82,000 | Land & Mo | |
| Blue Grass Properties Llc | $50,000 | Preferred T | |
| Tyler George W | $1,000 | -- |
Source: Public Records
Mortgage History
| Date | Status | Borrower | Loan Amount |
|---|---|---|---|
| Open | City View Homes Llc | $348,300 | |
| Closed | City County Holding Company | $250,000 | |
| Previous Owner | City View Homes Llc | $250,000 | |
| Previous Owner | City View Homes Llc | $5,150,000 | |
| Previous Owner | City View Homes Llc | $350,000 | |
| Previous Owner | City View Homes Llc | $420,000 | |
| Previous Owner | City View Homes Llc | $30,000 |
Source: Public Records
Tax History Compared to Growth
Tax History
| Year | Tax Paid | Tax Assessment Tax Assessment Total Assessment is a certain percentage of the fair market value that is determined by local assessors to be the total taxable value of land and additions on the property. | Land | Improvement |
|---|---|---|---|---|
| 2024 | $3,231 | $70,500 | $29,160 | $41,340 |
| 2023 | $3,191 | $70,490 | $29,155 | $41,335 |
| 2022 | $804 | $15,120 | $3,010 | $12,110 |
| 2021 | $805 | $15,120 | $3,010 | $12,110 |
| 2020 | $806 | $15,120 | $3,010 | $12,110 |
| 2019 | $783 | $12,600 | $2,520 | $10,080 |
| 2018 | $723 | $12,600 | $2,520 | $10,080 |
| 2017 | $756 | $12,600 | $2,520 | $10,080 |
| 2016 | $728 | $10,720 | $1,370 | $9,350 |
| 2015 | $663 | $10,720 | $1,370 | $9,350 |
| 2014 | $665 | $10,720 | $1,370 | $9,350 |
| 2013 | $364 | $11,900 | $1,505 | $10,395 |
Source: Public Records
Map
Nearby Homes
- 282 S Skidmore St
- 502 W Town St
- 743 Campbell Ave
- 775 Bellows Ave Unit 777
- 863 Campbell Ave
- 0 Bellows Ave
- 49 S Hartford Ave
- 45 S Hartford Ave
- 41 S Hartford Ave
- 286 Avondale Ave
- 339 Avondale Ave
- 273 Avondale Ave
- 1043 Bellows Ave
- 155 W Main St Unit 505
- 155 W Main St Unit 1901
- 308 S Cypress Ave
- 124 S Cypress Ave
- 278 S Glenwood Ave
- 69 Rodgers Ave
- 374 S Yale Ave