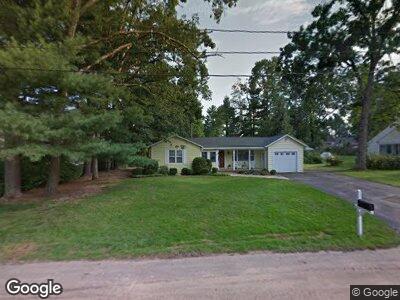
27 Sanford St East Longmeadow, MA 01028
Estimated Value: $303,168 - $370,000
3
Beds
2
Baths
1,249
Sq Ft
$263/Sq Ft
Est. Value
About This Home
This home is located at 27 Sanford St, East Longmeadow, MA 01028 and is currently estimated at $328,042, approximately $262 per square foot. 27 Sanford St is a home located in Hampden County with nearby schools including Meadowbrook Elementary School, Birchland Park Middle School, and East Longmeadow High School.
Ownership History
Date
Name
Owned For
Owner Type
Purchase Details
Closed on
Jun 30, 1986
Bought by
Hundley Richard C and Hundley Nancy A
Current Estimated Value
Create a Home Valuation Report for This Property
The Home Valuation Report is an in-depth analysis detailing your home's value as well as a comparison with similar homes in the area
Home Values in the Area
Average Home Value in this Area
Purchase History
| Date | Buyer | Sale Price | Title Company |
|---|---|---|---|
| Hundley Richard C | $85,000 | -- |
Source: Public Records
Mortgage History
| Date | Status | Borrower | Loan Amount |
|---|---|---|---|
| Open | Hundley Richard C | $161,057 | |
| Closed | Hundley Richard C | $169,708 | |
| Closed | Hundley Richard C | $115,200 | |
| Closed | Hundley Richard C | $13,500 | |
| Closed | Hundley Richard C | $10,000 | |
| Closed | Hundley Richard C | $87,300 |
Source: Public Records
Tax History Compared to Growth
Tax History
| Year | Tax Paid | Tax Assessment Tax Assessment Total Assessment is a certain percentage of the fair market value that is determined by local assessors to be the total taxable value of land and additions on the property. | Land | Improvement |
|---|---|---|---|---|
| 2025 | $5,185 | $280,600 | $135,100 | $145,500 |
| 2024 | $4,997 | $269,500 | $135,100 | $134,400 |
| 2023 | $4,717 | $245,700 | $122,800 | $122,900 |
| 2022 | $4,496 | $221,600 | $110,700 | $110,900 |
| 2021 | $4,399 | $208,900 | $102,600 | $106,300 |
| 2020 | $4,239 | $203,400 | $102,600 | $100,800 |
| 2019 | $4,059 | $197,500 | $99,500 | $98,000 |
| 2018 | $4,462 | $213,100 | $99,500 | $113,600 |
| 2017 | $4,335 | $208,700 | $97,400 | $111,300 |
| 2016 | $4,317 | $204,400 | $94,300 | $110,100 |
| 2015 | $4,235 | $204,400 | $94,300 | $110,100 |
Source: Public Records
Map
Nearby Homes