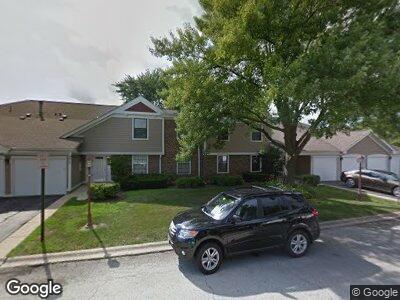
270 Middlebury Ct Unit 2642R Schaumburg, IL 60193
East Schaumburg NeighborhoodEstimated Value: $247,000 - $281,000
2
Beds
--
Bath
1,500
Sq Ft
$179/Sq Ft
Est. Value
About This Home
This home is located at 270 Middlebury Ct Unit 2642R, Schaumburg, IL 60193 and is currently estimated at $268,600, approximately $179 per square foot. 270 Middlebury Ct Unit 2642R is a home located in Cook County with nearby schools including Adolph Link Elementary School, Margaret Mead Junior High School, and J B Conant High School.
Ownership History
Date
Name
Owned For
Owner Type
Purchase Details
Closed on
Mar 31, 2021
Sold by
Hickland Nieca and Hickland Ronald I
Bought by
Ilbsg Infrastucture Company Llc
Current Estimated Value
Purchase Details
Closed on
Sep 11, 2014
Sold by
Private Ventures Inc
Bought by
Hickland Nieca
Home Financials for this Owner
Home Financials are based on the most recent Mortgage that was taken out on this home.
Original Mortgage
$108,000
Interest Rate
4.12%
Mortgage Type
New Conventional
Purchase Details
Closed on
Feb 1, 2013
Sold by
Buffa John P
Bought by
Private Ventures Inc
Purchase Details
Closed on
Nov 18, 1994
Sold by
Baker Charles and Baker Anna
Bought by
Buffa John P
Home Financials for this Owner
Home Financials are based on the most recent Mortgage that was taken out on this home.
Original Mortgage
$94,350
Interest Rate
8.91%
Mortgage Type
Assumption
Create a Home Valuation Report for This Property
The Home Valuation Report is an in-depth analysis detailing your home's value as well as a comparison with similar homes in the area
Home Values in the Area
Average Home Value in this Area
Purchase History
| Date | Buyer | Sale Price | Title Company |
|---|---|---|---|
| Ilbsg Infrastucture Company Llc | $178,000 | Precision Title | |
| Hickland Nieca | $135,000 | Prism Title | |
| Private Ventures Inc | $40,000 | None Available | |
| Buffa John P | $92,500 | Attorneys Title Guaranty Fun |
Source: Public Records
Mortgage History
| Date | Status | Borrower | Loan Amount |
|---|---|---|---|
| Previous Owner | Hickland Nieca | $108,000 | |
| Previous Owner | Private Ventures Inc | $210,000 | |
| Previous Owner | Buffa John P | $94,350 |
Source: Public Records
Tax History Compared to Growth
Tax History
| Year | Tax Paid | Tax Assessment Tax Assessment Total Assessment is a certain percentage of the fair market value that is determined by local assessors to be the total taxable value of land and additions on the property. | Land | Improvement |
|---|---|---|---|---|
| 2024 | $5,345 | $19,678 | $5,077 | $14,601 |
| 2023 | $5,345 | $19,678 | $5,077 | $14,601 |
| 2022 | $5,345 | $19,678 | $5,077 | $14,601 |
| 2021 | $4,658 | $15,368 | $6,505 | $8,863 |
| 2020 | $4,578 | $15,368 | $6,505 | $8,863 |
| 2019 | $4,579 | $17,085 | $6,505 | $10,580 |
| 2018 | $3,724 | $12,407 | $5,474 | $6,933 |
| 2017 | $3,665 | $12,407 | $5,474 | $6,933 |
| 2016 | $3,427 | $12,407 | $5,474 | $6,933 |
| 2015 | $3,041 | $10,165 | $4,760 | $5,405 |
| 2014 | $3,008 | $10,165 | $4,760 | $5,405 |
| 2013 | $2,173 | $10,165 | $4,760 | $5,405 |
Source: Public Records
Map
Nearby Homes
- 307 Maplewood Ct Unit B2
- 1500 7 Pines Rd Unit B1
- 322 Woodbury Ct Unit 1A
- 1376 Seven Pines Rd Unit C2
- 218 Deerpath Ct Unit B2
- 217 Arrowwood Ct Unit 512117
- 1417 Sturgeon Bay Ct
- 1396 Scarboro Rd Unit 1201
- 54 Egg Harbour Ct
- 1377 Scarboro Rd Unit 306
- 101 Bar Harbour Rd Unit 6E
- 1392 Grantham Dr
- 1375 Saint Claire Place
- 10 Nicolette Ave
- 297 University Ln Unit 196
- 261 University Ln
- 460 Kerri Ct Unit 3A
- 12 N Waterford Dr Unit 130F
- 1526 Idaho Place
- 102 N Waterford Dr Unit 125B