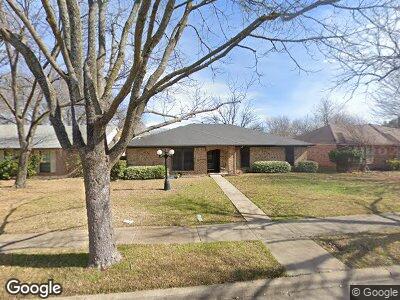
2724 Independence Dr Mesquite, TX 75150
Willow Glen NeighborhoodEstimated Value: $283,936 - $323,000
3
Beds
2
Baths
1,512
Sq Ft
$198/Sq Ft
Est. Value
About This Home
This home is located at 2724 Independence Dr, Mesquite, TX 75150 and is currently estimated at $299,234, approximately $197 per square foot. 2724 Independence Dr is a home located in Dallas County with nearby schools including Cannaday Elementary School, Kimbrough Middle School, and Poteet High School.
Ownership History
Date
Name
Owned For
Owner Type
Purchase Details
Closed on
Apr 22, 2014
Sold by
Duke Carolyn S
Bought by
Pacheco Melquiades Zapien and Zapien Maria R
Current Estimated Value
Home Financials for this Owner
Home Financials are based on the most recent Mortgage that was taken out on this home.
Original Mortgage
$116,844
Outstanding Balance
$90,877
Interest Rate
4.5%
Mortgage Type
FHA
Estimated Equity
$208,357
Purchase Details
Closed on
Aug 10, 2007
Sold by
Wooddell Joseph D and Wooddell Julie
Bought by
Duke Carolyn S
Home Financials for this Owner
Home Financials are based on the most recent Mortgage that was taken out on this home.
Original Mortgage
$62,000
Interest Rate
6.64%
Mortgage Type
Purchase Money Mortgage
Purchase Details
Closed on
Jul 26, 2004
Sold by
Garcia Manuel and Garcia Maria G
Bought by
Wooddell Joseph D
Home Financials for this Owner
Home Financials are based on the most recent Mortgage that was taken out on this home.
Original Mortgage
$90,400
Interest Rate
5.12%
Mortgage Type
Purchase Money Mortgage
Create a Home Valuation Report for This Property
The Home Valuation Report is an in-depth analysis detailing your home's value as well as a comparison with similar homes in the area
Home Values in the Area
Average Home Value in this Area
Purchase History
| Date | Buyer | Sale Price | Title Company |
|---|---|---|---|
| Pacheco Melquiades Zapien | -- | None Available | |
| Duke Carolyn S | -- | Natgf | |
| Wooddell Joseph D | -- | Nat |
Source: Public Records
Mortgage History
| Date | Status | Borrower | Loan Amount |
|---|---|---|---|
| Open | Pacheco Melquiades Zapien | $116,844 | |
| Previous Owner | Duke Carolyn S | $62,000 | |
| Previous Owner | Wooddell Joseph D | $90,400 | |
| Closed | Wooddell Joseph D | $22,600 |
Source: Public Records
Tax History Compared to Growth
Tax History
| Year | Tax Paid | Tax Assessment Tax Assessment Total Assessment is a certain percentage of the fair market value that is determined by local assessors to be the total taxable value of land and additions on the property. | Land | Improvement |
|---|---|---|---|---|
| 2023 | $6,579 | $256,630 | $55,000 | $201,630 |
| 2022 | $5,382 | $214,200 | $42,500 | $171,700 |
| 2021 | $5,392 | $204,460 | $42,500 | $161,960 |
| 2020 | $5,021 | $179,660 | $42,500 | $137,160 |
| 2019 | $4,976 | $170,960 | $40,000 | $130,960 |
| 2018 | $4,281 | $152,680 | $35,000 | $117,680 |
| 2017 | $4,379 | $156,280 | $30,000 | $126,280 |
| 2016 | $3,517 | $125,520 | $30,000 | $95,520 |
| 2015 | $1,193 | $120,090 | $24,000 | $96,090 |
| 2014 | $1,193 | $120,090 | $24,000 | $96,090 |
Source: Public Records
Map
Nearby Homes
- 2540 Red River St
- 2711 Eagle Pass
- 1418 Butterfield Dr
- 2417 Trenton Cir
- 922 Field Trail Dr
- 2731 Eagle Pass
- 2816 Red River St
- 2823 Rio Grande Pass
- 716 Fieldwood Dr
- 2337 Amesbury Dr
- 716 Retriever Ln
- 701 Retriever Ln
- 901 Us Highway 80 E
- 525 Clear Springs Dr
- 520 Newbury Dr
- 1104 Warwick Dr
- 1821 Ridgeview St
- 1805 Ridgeview St
- 1020 U S 80
- 2217 Salerno Dr