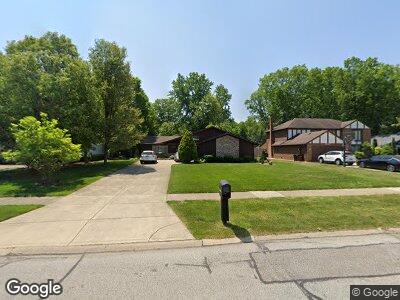
27411 Pineview Dr Westlake, OH 44145
Estimated Value: $369,903 - $497,000
4
Beds
3
Baths
2,472
Sq Ft
$171/Sq Ft
Est. Value
About This Home
This home is located at 27411 Pineview Dr, Westlake, OH 44145 and is currently estimated at $421,976, approximately $170 per square foot. 27411 Pineview Dr is a home located in Cuyahoga County with nearby schools including Dover Intermediate School, Lee Burneson Middle School, and Westlake High School.
Ownership History
Date
Name
Owned For
Owner Type
Purchase Details
Closed on
Jul 24, 1998
Sold by
Kim James H and Ye Kim Myung
Bought by
Suhadolnik Joseph S and Suhadolnik Vickie A
Current Estimated Value
Home Financials for this Owner
Home Financials are based on the most recent Mortgage that was taken out on this home.
Original Mortgage
$70,000
Interest Rate
7.03%
Purchase Details
Closed on
Jul 19, 1990
Sold by
Mersing Ethel M
Bought by
Kim James H
Purchase Details
Closed on
Aug 18, 1987
Sold by
Mersing David C and Mersing Ethel M
Bought by
Mersing Ethel M
Purchase Details
Closed on
Sep 7, 1979
Bought by
Mersing David C and Mersing Ethel M
Purchase Details
Closed on
Aug 9, 1978
Sold by
Stradtman John G
Bought by
Bennett Contractors Inc
Purchase Details
Closed on
Jan 1, 1978
Bought by
Stradtman John G
Create a Home Valuation Report for This Property
The Home Valuation Report is an in-depth analysis detailing your home's value as well as a comparison with similar homes in the area
Home Values in the Area
Average Home Value in this Area
Purchase History
| Date | Buyer | Sale Price | Title Company |
|---|---|---|---|
| Suhadolnik Joseph S | $179,900 | Guardian Title | |
| Kim James H | $174,900 | -- | |
| Mersing Ethel M | -- | -- | |
| Mersing David C | $108,400 | -- | |
| Bennett Contractors Inc | -- | -- | |
| Stradtman John G | -- | -- |
Source: Public Records
Mortgage History
| Date | Status | Borrower | Loan Amount |
|---|---|---|---|
| Open | Suhadolnik Joseph S | $224,700 | |
| Closed | Suhadolnik Joseph S | $70,000 |
Source: Public Records
Tax History Compared to Growth
Tax History
| Year | Tax Paid | Tax Assessment Tax Assessment Total Assessment is a certain percentage of the fair market value that is determined by local assessors to be the total taxable value of land and additions on the property. | Land | Improvement |
|---|---|---|---|---|
| 2024 | $5,259 | $120,820 | $25,620 | $95,200 |
| 2023 | $4,415 | $88,840 | $22,860 | $65,980 |
| 2022 | $4,367 | $88,830 | $22,860 | $65,980 |
| 2021 | $4,850 | $88,830 | $22,860 | $65,980 |
| 2020 | $4,896 | $82,250 | $21,180 | $61,080 |
| 2019 | $4,747 | $235,000 | $60,500 | $174,500 |
| 2018 | $4,540 | $82,250 | $21,180 | $61,080 |
| 2017 | $4,360 | $70,740 | $19,460 | $51,280 |
| 2016 | $4,336 | $70,740 | $19,460 | $51,280 |
| 2015 | $4,288 | $70,740 | $19,460 | $51,280 |
| 2014 | $4,288 | $68,670 | $18,900 | $49,770 |
Source: Public Records
Map
Nearby Homes
- 27441 Westown Blvd
- 3101 Macintosh Dr Unit 301
- 3181 Dover Center Rd
- 2930 N Bay Dr Unit L8
- 2917 N Bay Dr Unit M15
- 2820 N Bay Dr Unit P16
- 3700 Greenbriar Cir
- 28080 Center Ridge Rd
- 28290 Hallberg Dr
- 3883 Woodpark Ln
- 28276 Hallberg Dr
- 28282 Hallberg Dr
- 28264 Hallberg Dr
- 27475 Edgepark Blvd
- 28252 Hallberg Dr
- 2890 Margaretta Dr
- 26821 Sweetbriar Dr
- 26622 Sweetbriar Dr
- 28320 W Preston Place
- 25832 Iris Ct