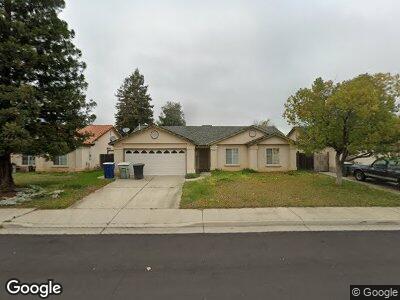
2748 4th St Sanger, CA 93657
Estimated Value: $353,259 - $433,000
3
Beds
2
Baths
1,419
Sq Ft
$279/Sq Ft
Est. Value
About This Home
This home is located at 2748 4th St, Sanger, CA 93657 and is currently estimated at $395,565, approximately $278 per square foot. 2748 4th St is a home located in Fresno County with nearby schools including Reagan Elementary School, Washington Academic Middle School, and Sanger High School.
Ownership History
Date
Name
Owned For
Owner Type
Purchase Details
Closed on
May 9, 2017
Sold by
Dowins William Glen
Bought by
Fullerton Angelique
Current Estimated Value
Purchase Details
Closed on
Nov 8, 2002
Sold by
Romo Anthony L and Romo Elizabeth D
Bought by
Downs William Glenn and Downs Angelique
Home Financials for this Owner
Home Financials are based on the most recent Mortgage that was taken out on this home.
Original Mortgage
$141,501
Interest Rate
5.86%
Mortgage Type
FHA
Purchase Details
Closed on
May 22, 1996
Sold by
Vineyard Glen Partners
Bought by
Romo Anthony L and Romo Elizabeth D
Home Financials for this Owner
Home Financials are based on the most recent Mortgage that was taken out on this home.
Original Mortgage
$104,550
Interest Rate
6.5%
Mortgage Type
FHA
Create a Home Valuation Report for This Property
The Home Valuation Report is an in-depth analysis detailing your home's value as well as a comparison with similar homes in the area
Home Values in the Area
Average Home Value in this Area
Purchase History
| Date | Buyer | Sale Price | Title Company |
|---|---|---|---|
| Downs William Glenn | $143,500 | Chicago Title Company | |
| Romo Anthony L | $105,500 | Central Title Company |
Source: Public Records
Mortgage History
| Date | Status | Borrower | Loan Amount |
|---|---|---|---|
| Open | Downs William Glenn | $115,077 | |
| Closed | Downs William Glenn | $141,221 | |
| Previous Owner | Downs William Glenn | $141,501 | |
| Previous Owner | Romo Anthony L | $30,000 | |
| Previous Owner | Romo Anthony L | $102,572 | |
| Previous Owner | Romo Anthony L | $104,550 |
Source: Public Records
Tax History Compared to Growth
Tax History
| Year | Tax Paid | Tax Assessment Tax Assessment Total Assessment is a certain percentage of the fair market value that is determined by local assessors to be the total taxable value of land and additions on the property. | Land | Improvement |
|---|---|---|---|---|
| 2023 | $2,390 | $199,744 | $44,535 | $155,209 |
| 2022 | $2,352 | $195,828 | $43,662 | $152,166 |
| 2021 | $2,331 | $191,989 | $42,806 | $149,183 |
| 2020 | $2,262 | $190,022 | $42,368 | $147,654 |
| 2019 | $2,215 | $186,297 | $41,538 | $144,759 |
| 2018 | $2,122 | $182,645 | $40,724 | $141,921 |
| 2017 | $2,084 | $179,065 | $39,926 | $139,139 |
| 2016 | $1,957 | $175,555 | $39,144 | $136,411 |
| 2015 | $1,972 | $172,919 | $38,557 | $134,362 |
| 2014 | $1,925 | $167,900 | $37,200 | $130,700 |
Source: Public Records
Map
Nearby Homes
- 371 Bethel Ave Unit 88
- 371 Bethel Ave Unit 86
- 2960 3rd St
- 2767 Casty Ct
- 2692 Holt Ave
- 11333 E Church Ave
- 2499 Florence Ave
- 2732 Atchison Ave
- 34 Fairbanks Ave
- 504 Greenwood Ave
- 2018 Mary St
- 2136 Florence Ave
- 1112 Cottle Ave
- 2426 Almond Ave
- 2129 Magnolia Ave
- 2599 Almond Ave
- 0 Almond (322-030-51) Unit 603807
- 1930 Hawley Ave Unit 2040S
- 1938 Hawley Ave Unit 2039S
- 1948 Hawley Ave Unit 2038S