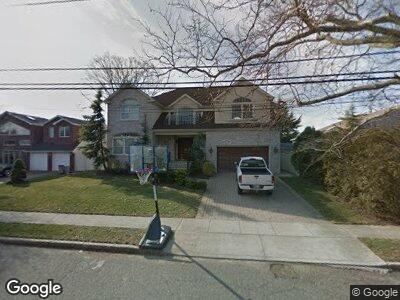
2768 Lindenmere Dr Merrick, NY 11566
Merrick NeighborhoodEstimated Value: $1,521,366 - $1,712,000
--
Bed
5
Baths
3,868
Sq Ft
$418/Sq Ft
Est. Value
About This Home
This home is located at 2768 Lindenmere Dr, Merrick, NY 11566 and is currently estimated at $1,616,683, approximately $417 per square foot. 2768 Lindenmere Dr is a home located in Nassau County with nearby schools including Merrick Avenue Middle School, John F. Kennedy High School, and Grace Christian Academy.
Ownership History
Date
Name
Owned For
Owner Type
Purchase Details
Closed on
Mar 8, 2021
Sold by
Milligan Realty Inc
Bought by
Surujnarain Dave and Samaria Amanda
Current Estimated Value
Purchase Details
Closed on
Oct 20, 2016
Sold by
D'Occhio Antonia M
Bought by
Milligan Realty Inc
Home Financials for this Owner
Home Financials are based on the most recent Mortgage that was taken out on this home.
Original Mortgage
$630,000
Interest Rate
3.48%
Mortgage Type
Construction
Purchase Details
Closed on
Jun 17, 2015
Sold by
Smith Ryan
Bought by
Occhio Antonia M D
Purchase Details
Closed on
Jun 9, 2015
Sold by
Cole Damian
Bought by
Docchio Antonia M
Purchase Details
Closed on
Jun 28, 2007
Sold by
Cole Damian
Purchase Details
Closed on
Jan 26, 2007
Sold by
Dunk Hill Farms Inc
Bought by
Cole Damian
Create a Home Valuation Report for This Property
The Home Valuation Report is an in-depth analysis detailing your home's value as well as a comparison with similar homes in the area
Home Values in the Area
Average Home Value in this Area
Purchase History
| Date | Buyer | Sale Price | Title Company |
|---|---|---|---|
| Surujnarain Dave | $950,000 | Old Republic Title | |
| Milligan Realty Inc | $775,000 | Citi Abstract Inc | |
| Occhio Antonia M D | -- | The Judicial Title Ins | |
| Docchio Antonia M | -- | The Judicial Title Ins | |
| -- | -- | -- | |
| Cole Damian | $999,999 | -- |
Source: Public Records
Mortgage History
| Date | Status | Borrower | Loan Amount |
|---|---|---|---|
| Previous Owner | Milligan Realty Inc | $630,000 | |
| Previous Owner | Smithcomes Ellen Sesskin | $315,000 |
Source: Public Records
Tax History Compared to Growth
Tax History
| Year | Tax Paid | Tax Assessment Tax Assessment Total Assessment is a certain percentage of the fair market value that is determined by local assessors to be the total taxable value of land and additions on the property. | Land | Improvement |
|---|---|---|---|---|
| 2024 | $9,581 | $1,384 | $319 | $1,065 |
| 2023 | $36,425 | $1,332 | $307 | $1,025 |
| 2022 | $36,425 | $1,609 | $371 | $1,238 |
| 2021 | $63,497 | $1,547 | $357 | $1,190 |
| 2020 | $43,504 | $2,287 | $1,202 | $1,085 |
| 2019 | $10,635 | $2,287 | $1,202 | $1,085 |
| 2018 | $10,148 | $2,287 | $0 | $0 |
| 2017 | $26,315 | $2,287 | $1,202 | $1,085 |
| 2016 | $36,103 | $2,287 | $854 | $1,433 |
| 2015 | $9,580 | $2,414 | $902 | $1,512 |
| 2014 | $9,580 | $2,414 | $902 | $1,512 |
| 2013 | $12,084 | $3,218 | $1,202 | $2,016 |
Source: Public Records
Map
Nearby Homes
- 2729 Shore Dr
- 1951 Helen Ct
- 1956 Leonard Ln
- 1896 Helen Ct
- 4 Bonnie Ct
- 2884 Joyce Ln
- 2872 Rosebud Ave
- 2932 Joyce Ln
- 2814 Colonial Ave
- 2910 Lonni Ln
- 118 Brighton Way
- 2721 Covered Bridge Rd
- 2925 Hewlett Ave
- 2810 Wynsum Ave
- 2956 Judith Dr
- 3001 Hewlett Ave
- 2854 Wynsum Ave
- 1721 James St
- 3032 Hewlett Ave
- 1673 N Gate