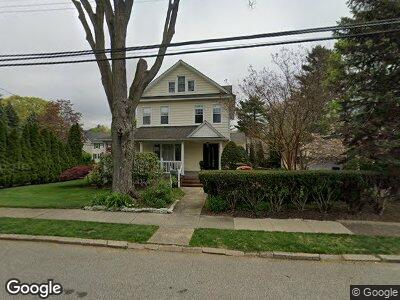
28 High St East Williston, NY 11596
East Williston NeighborhoodEstimated Value: $1,452,820 - $2,080,000
4
Beds
4
Baths
2,342
Sq Ft
$754/Sq Ft
Est. Value
About This Home
This home is located at 28 High St, East Williston, NY 11596 and is currently estimated at $1,766,410, approximately $754 per square foot. 28 High St is a home located in Nassau County with nearby schools including North Side School, Willets Road School, and The Wheatley School.
Ownership History
Date
Name
Owned For
Owner Type
Purchase Details
Closed on
Jul 2, 2018
Sold by
Mattioli Ronald and Mattioli Diane
Bought by
Rosenzweig Lee E and Rosenzweig Clintona
Current Estimated Value
Home Financials for this Owner
Home Financials are based on the most recent Mortgage that was taken out on this home.
Original Mortgage
$453,200
Interest Rate
4.5%
Mortgage Type
New Conventional
Purchase Details
Closed on
May 9, 2006
Sold by
Bianco John
Bought by
Mattioli Ronald
Purchase Details
Closed on
May 22, 2000
Sold by
Snyder Richard C
Bought by
Bianco John J
Purchase Details
Closed on
Sep 30, 1999
Sold by
Saridakis Andrew and Saridakis Dorothy
Bought by
Snyder Richard C and Snyder Ronnie B
Home Financials for this Owner
Home Financials are based on the most recent Mortgage that was taken out on this home.
Original Mortgage
$420,000
Interest Rate
7.12%
Mortgage Type
Purchase Money Mortgage
Create a Home Valuation Report for This Property
The Home Valuation Report is an in-depth analysis detailing your home's value as well as a comparison with similar homes in the area
Home Values in the Area
Average Home Value in this Area
Purchase History
| Date | Buyer | Sale Price | Title Company |
|---|---|---|---|
| Rosenzweig Lee E | $975,000 | First American Title | |
| Mattioli Ronald | $930,000 | -- | |
| Bianco John J | $536,000 | John Kupillas | |
| Snyder Richard C | $525,000 | -- |
Source: Public Records
Mortgage History
| Date | Status | Borrower | Loan Amount |
|---|---|---|---|
| Open | Rosenzweig Lee E | $415,000 | |
| Closed | Rosenzweig Lee E | $453,200 | |
| Previous Owner | Mattioli Ronald | $353,000 | |
| Previous Owner | Snyder Richard C | $420,000 |
Source: Public Records
Tax History Compared to Growth
Tax History
| Year | Tax Paid | Tax Assessment Tax Assessment Total Assessment is a certain percentage of the fair market value that is determined by local assessors to be the total taxable value of land and additions on the property. | Land | Improvement |
|---|---|---|---|---|
| 2024 | $3,502 | $874 | $404 | $470 |
| 2023 | $18,441 | $923 | $427 | $496 |
| 2022 | $18,441 | $1,016 | $470 | $546 |
| 2021 | $20,153 | $975 | $359 | $616 |
| 2020 | $19,694 | $1,415 | $1,176 | $239 |
| 2019 | $16,816 | $1,415 | $1,103 | $312 |
| 2018 | $16,816 | $1,509 | $0 | $0 |
| 2017 | $12,839 | $1,509 | $1,176 | $333 |
| 2016 | $16,362 | $1,509 | $1,176 | $333 |
| 2015 | $3,408 | $1,509 | $1,176 | $333 |
| 2014 | $3,408 | $1,509 | $1,176 | $333 |
| 2013 | $3,226 | $1,509 | $1,176 | $333 |
Source: Public Records
Map
Nearby Homes