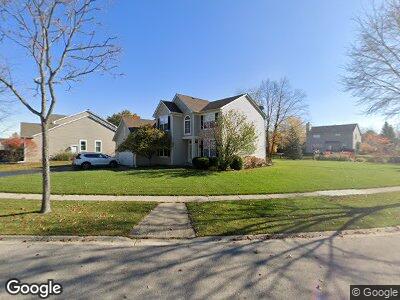
281 Tenby Way Algonquin, IL 60102
Far West Algonquin NeighborhoodEstimated Value: $404,076 - $516,000
4
Beds
3
Baths
2,638
Sq Ft
$182/Sq Ft
Est. Value
About This Home
This home is located at 281 Tenby Way, Algonquin, IL 60102 and is currently estimated at $479,519, approximately $181 per square foot. 281 Tenby Way is a home located in McHenry County with nearby schools including Mackeben Elementary School, Conley Elementary School, and Heineman Middle School.
Ownership History
Date
Name
Owned For
Owner Type
Purchase Details
Closed on
Jul 1, 2003
Sold by
Cendant Mobility Financial Corp
Bought by
Noie Christopher N and Noie Jennifer L
Current Estimated Value
Home Financials for this Owner
Home Financials are based on the most recent Mortgage that was taken out on this home.
Original Mortgage
$192,500
Interest Rate
6.01%
Mortgage Type
Purchase Money Mortgage
Purchase Details
Closed on
Apr 21, 2003
Sold by
Leggett Donzel A and Leggett Tracy A
Bought by
Cendant Mobility Financial Corp
Purchase Details
Closed on
Oct 28, 1999
Sold by
The Ryland Group Inc
Bought by
Leggett Donzel A and Leggett Tracy A
Home Financials for this Owner
Home Financials are based on the most recent Mortgage that was taken out on this home.
Original Mortgage
$223,000
Interest Rate
7.12%
Create a Home Valuation Report for This Property
The Home Valuation Report is an in-depth analysis detailing your home's value as well as a comparison with similar homes in the area
Home Values in the Area
Average Home Value in this Area
Purchase History
| Date | Buyer | Sale Price | Title Company |
|---|---|---|---|
| Noie Christopher N | $292,500 | Burnet Title Llc | |
| Cendant Mobility Financial Corp | $310,500 | Burnet Title Llc | |
| Leggett Donzel A | $242,000 | -- |
Source: Public Records
Mortgage History
| Date | Status | Borrower | Loan Amount |
|---|---|---|---|
| Open | Noie Jennifer L | $241,000 | |
| Closed | Christopher N | $100,000 | |
| Closed | Noie Christopher N | $169,556 | |
| Closed | Noie Christopher N | $192,000 | |
| Previous Owner | Noie Christopher N | $192,500 | |
| Previous Owner | Leggett Donzel A | $50,000 | |
| Previous Owner | Leggett Donzel A | $223,000 |
Source: Public Records
Tax History Compared to Growth
Tax History
| Year | Tax Paid | Tax Assessment Tax Assessment Total Assessment is a certain percentage of the fair market value that is determined by local assessors to be the total taxable value of land and additions on the property. | Land | Improvement |
|---|---|---|---|---|
| 2023 | $9,268 | $123,774 | $15,902 | $107,872 |
| 2022 | $8,824 | $112,706 | $14,480 | $98,226 |
| 2021 | $8,526 | $106,146 | $13,637 | $92,509 |
| 2020 | $8,399 | $103,315 | $13,273 | $90,042 |
| 2019 | $8,178 | $100,677 | $12,934 | $87,743 |
| 2018 | $9,841 | $117,278 | $14,556 | $102,722 |
| 2017 | $9,733 | $110,525 | $13,718 | $96,807 |
| 2016 | $9,823 | $105,081 | $13,042 | $92,039 |
| 2013 | -- | $98,065 | $16,618 | $81,447 |
Source: Public Records
Map
Nearby Homes
- 4085 Whitehall Ln
- 2 Liam Ct
- 4190 Bunker Hill Dr
- 801 Treeline Dr
- 1 Austrian Ct
- 4220 Wanderlust Dr
- 9105 Algonquin Rd
- 501 Clover Dr
- 2111 Schmitt Cir
- 940 Treeline Dr
- 531 Alpine Dr
- 4151 Wanderlust Dr
- 13 Benton Ct
- 620 Bluestem Ln
- 3700 Persimmon Dr
- 3620 Lakeview Dr
- 670 Bluestem Ln
- 1591 Timberland Dr
- 6 Black Diamond Ct
- 3520 Lakeview Dr