2814 9th St N Fargo, ND 58102
Northport NeighborhoodEstimated Value: $237,000
--
Bed
--
Bath
1,075
Sq Ft
$220/Sq Ft
Est. Value
About This Home
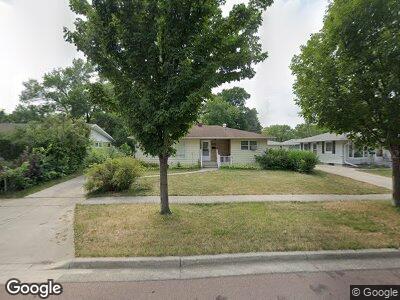
This home is located at 2814 9th St N, Fargo, ND 58102 and is currently estimated at $237,000, approximately $220 per square foot. 2814 9th St N is a home located in Cass County with nearby schools including McKinley Elementary School, Ben Franklin Middle School, and North High School.
Create a Home Valuation Report for This Property
The Home Valuation Report is an in-depth analysis detailing your home's value as well as a comparison with similar homes in the area
Home Values in the Area
Average Home Value in this Area
Tax History Compared to Growth
Tax History
| Year | Tax Paid | Tax Assessment Tax Assessment Total Assessment is a certain percentage of the fair market value that is determined by local assessors to be the total taxable value of land and additions on the property. | Land | Improvement |
|---|---|---|---|---|
| 2024 | $333 | $117,300 | $25,650 | $91,650 |
| 2023 | $618 | $110,650 | $25,650 | $85,000 |
| 2022 | $1,483 | $104,400 | $25,650 | $78,750 |
| 2021 | $2,047 | $101,350 | $25,650 | $75,700 |
| 2020 | $1,053 | $94,700 | $25,650 | $69,050 |
| 2019 | $932 | $94,700 | $14,250 | $80,450 |
| 2018 | $1,080 | $100,800 | $14,250 | $86,550 |
| 2017 | $993 | $97,850 | $14,250 | $83,600 |
| 2016 | $2,139 | $88,950 | $14,250 | $74,700 |
| 2015 | $1,053 | $88,950 | $10,700 | $78,250 |
| 2014 | $472 | $66,150 | $10,700 | $55,450 |
| 2013 | $1,638 | $63,000 | $10,700 | $52,300 |
Source: Public Records