2818 S Lipscomb St Amarillo, TX 79109
Wolflin NeighborhoodEstimated Value: $1,449,000 - $2,511,989
3
Beds
3
Baths
2,899
Sq Ft
$681/Sq Ft
Est. Value
About This Home
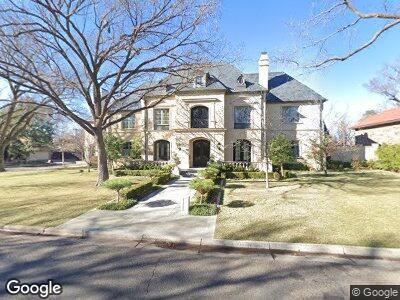
This home is located at 2818 S Lipscomb St, Amarillo, TX 79109 and is currently estimated at $1,973,663, approximately $680 per square foot. 2818 S Lipscomb St is a home located in Randall County with nearby schools including Wolflin Elementary School, Carver Early Childhood Academy, and George Washington Carver Elementary Academy.
Ownership History
Date
Name
Owned For
Owner Type
Purchase Details
Closed on
Jun 24, 2016
Sold by
Roberts Blaine D
Bought by
Liv Roberts Blaine D and Blaine D Roberts Revocable Living Trust
Current Estimated Value
Purchase Details
Closed on
Jun 14, 2016
Sold by
Roberts Blaine D
Bought by
Liv Roberts Blaine D and Blaine D Roberts Revocable Living Trust
Purchase Details
Closed on
Sep 12, 2011
Sold by
Budzynski Farrell Homes Llc
Bought by
Roberts Blaine D
Purchase Details
Closed on
Sep 9, 2011
Sold by
Currie Tully Jenks and Currie Erica H
Bought by
Budzynski Farrell Homes Llc
Purchase Details
Closed on
Sep 18, 2007
Sold by
Mcelreath Richard E and Mcelreath Jennifer
Bought by
Currie Tully Jenks
Home Financials for this Owner
Home Financials are based on the most recent Mortgage that was taken out on this home.
Original Mortgage
$310,000
Interest Rate
6.66%
Mortgage Type
Purchase Money Mortgage
Create a Home Valuation Report for This Property
The Home Valuation Report is an in-depth analysis detailing your home's value as well as a comparison with similar homes in the area
Home Values in the Area
Average Home Value in this Area
Purchase History
| Date | Buyer | Sale Price | Title Company |
|---|---|---|---|
| Liv Roberts Blaine D | -- | None Available | |
| Liv Roberts Blaine D | -- | None Available | |
| Roberts Blaine D | -- | Circle Ttile Company | |
| Budzynski Farrell Homes Llc | -- | None Available | |
| Currie Tully Jenks | -- | Ctic |
Source: Public Records
Mortgage History
| Date | Status | Borrower | Loan Amount |
|---|---|---|---|
| Previous Owner | Currie Tully Jenks | $294,800 | |
| Previous Owner | Currie Tully Jenks | $18,000 | |
| Previous Owner | Currie Tully Jenks | $310,000 | |
| Previous Owner | Mcelreath Richard | $63,000 | |
| Previous Owner | Mcelreath Richard E | $216,932 |
Source: Public Records
Tax History Compared to Growth
Tax History
| Year | Tax Paid | Tax Assessment Tax Assessment Total Assessment is a certain percentage of the fair market value that is determined by local assessors to be the total taxable value of land and additions on the property. | Land | Improvement |
|---|---|---|---|---|
| 2024 | $43,968 | $2,473,946 | $84,000 | $2,389,946 |
| 2023 | $41,085 | $2,356,350 | $84,000 | $2,272,350 |
| 2022 | $41,044 | $2,210,636 | $84,000 | $2,126,636 |
| 2021 | $38,940 | $1,750,664 | $84,000 | $1,666,664 |
| 2020 | $38,281 | $1,719,204 | $84,000 | $1,635,204 |
| 2019 | $38,529 | $1,715,328 | $84,000 | $1,631,328 |
| 2018 | $37,306 | $1,715,328 | $84,000 | $1,631,328 |
| 2017 | $31,941 | $1,477,437 | $84,000 | $1,393,437 |
| 2016 | $31,469 | $1,323,265 | $84,000 | $1,239,265 |
| 2015 | $13,567 | $1,323,265 | $84,000 | $1,239,265 |
| 2014 | $13,567 | $633,746 | $84,000 | $549,746 |
Source: Public Records
Map
Nearby Homes
- 33 Oldham Cir
- 2614 Parker St
- 2606 S Lipscomb St
- 3001 S Hayden St
- 2816 Bowie St
- 3205 S Ong St
- 3207 Parker St
- 2615 S Hayden St
- 3211 Bowie St
- 3003 S Hughes St
- 2410 Parker St
- 3011 S Hughes St
- 3218 Parker St
- 2805 S Bonham St
- 3228 S Travis St
- 2404 S Ong St
- 2600 S Washington St
- 2422 S Washington St
- 2223 S Ong St
- 2222 S Hayden St