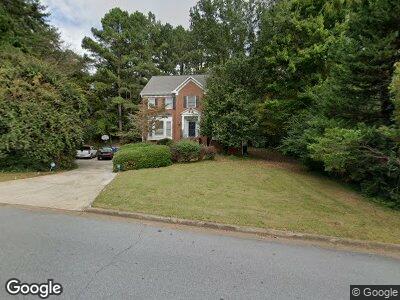
2820 Arborwoods Dr Alpharetta, GA 30022
Newtown NeighborhoodEstimated Value: $597,000 - $663,612
4
Beds
4
Baths
2,562
Sq Ft
$250/Sq Ft
Est. Value
About This Home
This home is located at 2820 Arborwoods Dr, Alpharetta, GA 30022 and is currently estimated at $639,653, approximately $249 per square foot. 2820 Arborwoods Dr is a home located in Fulton County with nearby schools including Hillside Elementary School, Haynes Bridge Middle School, and Centennial High School.
Ownership History
Date
Name
Owned For
Owner Type
Purchase Details
Closed on
Dec 30, 2008
Sold by
C & Bass Series 2007 & Cb3
Bought by
Wu Jun
Current Estimated Value
Home Financials for this Owner
Home Financials are based on the most recent Mortgage that was taken out on this home.
Original Mortgage
$194,400
Interest Rate
5.95%
Mortgage Type
New Conventional
Purchase Details
Closed on
Aug 5, 2008
Sold by
Gates John B and Gates Ella
Bought by
C & Bass Series 2007 & Cb3
Purchase Details
Closed on
Feb 17, 1998
Sold by
Simmons Kenneth C
Bought by
Gates John B
Home Financials for this Owner
Home Financials are based on the most recent Mortgage that was taken out on this home.
Original Mortgage
$204,000
Interest Rate
6.86%
Mortgage Type
New Conventional
Create a Home Valuation Report for This Property
The Home Valuation Report is an in-depth analysis detailing your home's value as well as a comparison with similar homes in the area
Home Values in the Area
Average Home Value in this Area
Purchase History
| Date | Buyer | Sale Price | Title Company |
|---|---|---|---|
| Wu Jun | $243,000 | -- | |
| C & Bass Series 2007 & Cb3 | $265,400 | -- | |
| Gates John B | $226,800 | -- |
Source: Public Records
Mortgage History
| Date | Status | Borrower | Loan Amount |
|---|---|---|---|
| Open | Wu Jun | $58,400 | |
| Open | Wu Jun | $194,000 | |
| Closed | Wu Jun | $200,000 | |
| Closed | Wu Jun | $187,000 | |
| Closed | Wu Jun | $190,000 | |
| Closed | Wu Jun | $194,400 | |
| Previous Owner | Gates John B | $74,000 | |
| Previous Owner | Gates John B | $295,000 | |
| Previous Owner | Gates John B | $30,000 | |
| Previous Owner | Gates John B | $288,000 | |
| Previous Owner | Gates John B | $204,000 |
Source: Public Records
Tax History Compared to Growth
Tax History
| Year | Tax Paid | Tax Assessment Tax Assessment Total Assessment is a certain percentage of the fair market value that is determined by local assessors to be the total taxable value of land and additions on the property. | Land | Improvement |
|---|---|---|---|---|
| 2023 | $4,063 | $196,000 | $58,800 | $137,200 |
| 2022 | $5,179 | $183,480 | $49,760 | $133,720 |
| 2021 | $3,217 | $114,000 | $29,360 | $84,640 |
| 2020 | $3,281 | $114,000 | $29,360 | $84,640 |
| 2019 | $396 | $114,000 | $29,360 | $84,640 |
| 2018 | $3,314 | $114,000 | $29,360 | $84,640 |
| 2017 | $3,466 | $114,000 | $29,360 | $84,640 |
| 2016 | $3,408 | $114,000 | $29,360 | $84,640 |
| 2015 | $3,445 | $114,000 | $29,360 | $84,640 |
| 2014 | $3,088 | $118,360 | $31,360 | $87,000 |
Source: Public Records
Map
Nearby Homes
- 9425 Nesbit Ferry Rd
- 2885 Arborwoods Dr
- 160 Arden Place
- 2870 Abbottswell Dr
- 635 Holyrood Way
- 3060 Birchton St
- 315 Chandon Place Ct
- 7 Nesbit Place
- 230 Winnipeg Ln
- 3105 Birchton St Unit 1
- 1026 Township Square
- 95 Nesbit Reserve Ct
- 3045 Hartridge Dr
- 2008 Falcon Glen Ct
- 211 Buckland Dr
- 1071 Township Square