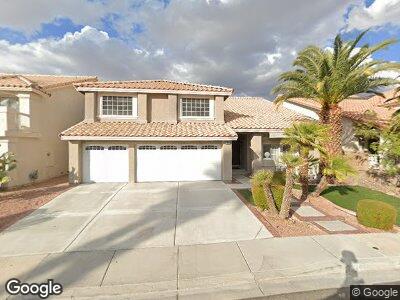
2826 Via Florentine St Henderson, NV 89074
Green Valley North NeighborhoodEstimated Value: $654,004 - $709,000
5
Beds
3
Baths
3,549
Sq Ft
$192/Sq Ft
Est. Value
About This Home
This home is located at 2826 Via Florentine St, Henderson, NV 89074 and is currently estimated at $681,001, approximately $191 per square foot. 2826 Via Florentine St is a home located in Clark County with nearby schools including David M Cox Elementary School, Barbara and Hank Greenspun Junior High School, and Silverado High School.
Ownership History
Date
Name
Owned For
Owner Type
Purchase Details
Closed on
Dec 22, 2022
Sold by
Persad Nerlin
Bought by
Archer Nadeen L
Current Estimated Value
Purchase Details
Closed on
Apr 24, 2009
Sold by
Andrews R Gregory and Archer Nadeen L
Bought by
Archer Nadeen L
Home Financials for this Owner
Home Financials are based on the most recent Mortgage that was taken out on this home.
Original Mortgage
$228,000
Interest Rate
4.99%
Mortgage Type
Stand Alone Refi Refinance Of Original Loan
Purchase Details
Closed on
Jul 12, 2001
Sold by
Brock James W and Brock Susan M
Bought by
Andrews R Gregory and Andrews Nadeen
Home Financials for this Owner
Home Financials are based on the most recent Mortgage that was taken out on this home.
Original Mortgage
$223,800
Interest Rate
7.26%
Create a Home Valuation Report for This Property
The Home Valuation Report is an in-depth analysis detailing your home's value as well as a comparison with similar homes in the area
Home Values in the Area
Average Home Value in this Area
Purchase History
| Date | Buyer | Sale Price | Title Company |
|---|---|---|---|
| Archer Nadeen L | -- | Title Deeds & Needs | |
| Archer Nadeen L | -- | Lawyers Title Of Nevada Cent | |
| Andrews R Gregory | $279,777 | First American Title Co |
Source: Public Records
Mortgage History
| Date | Status | Borrower | Loan Amount |
|---|---|---|---|
| Previous Owner | Archer Nadeen L | $228,000 | |
| Previous Owner | Andrews R Gregory | $75,000 | |
| Previous Owner | Andrews R Gregory | $233,000 | |
| Previous Owner | Andrews R Gregory | $221,005 | |
| Previous Owner | Andrews R Gregory | $223,800 |
Source: Public Records
Tax History Compared to Growth
Tax History
| Year | Tax Paid | Tax Assessment Tax Assessment Total Assessment is a certain percentage of the fair market value that is determined by local assessors to be the total taxable value of land and additions on the property. | Land | Improvement |
|---|---|---|---|---|
| 2025 | $3,339 | $154,582 | $49,000 | $105,582 |
| 2024 | $3,243 | $154,582 | $49,000 | $105,582 |
| 2023 | $3,243 | $140,812 | $39,550 | $101,262 |
| 2022 | $3,148 | $128,152 | $35,000 | $93,152 |
| 2021 | $3,057 | $124,097 | $35,000 | $89,097 |
| 2020 | $2,965 | $121,370 | $32,550 | $88,820 |
| 2019 | $2,929 | $117,801 | $29,750 | $88,051 |
| 2018 | $2,795 | $110,983 | $26,250 | $84,733 |
| 2017 | $3,267 | $112,695 | $26,250 | $86,445 |
| 2016 | $2,616 | $107,729 | $20,650 | $87,079 |
| 2015 | $2,611 | $88,996 | $16,100 | $72,896 |
| 2014 | $2,534 | $85,749 | $12,250 | $73,499 |
Source: Public Records
Map
Nearby Homes
- 2813 Via Avanti St
- 2812 Via Avanti St
- 2816 Via Bel Mondo St
- 2785 Carnation Ln Unit 6
- 239 Highgate St
- 2899 Bluebonnet Dr Unit 2899
- 2819 Bluebonnet Dr Unit 6
- 2750 Sandalwood Ave
- 2747 Sandalwood Ave
- 2744 Pala Dura Dr
- 2586 Begonia Valley Ave
- 2766 Chokecherry Ave
- 2975 Bluegrass Ln Unit 811
- 2975 Bluegrass Ln Unit 412
- 2975 Bluegrass Ln Unit 422
- 2813 Mayfair Ave
- 2735 Briarcliff Ave
- 2526 Begonia Valley Ave
- 2787 Fountain Ridge Ln
- 7990 Firethorn Ln