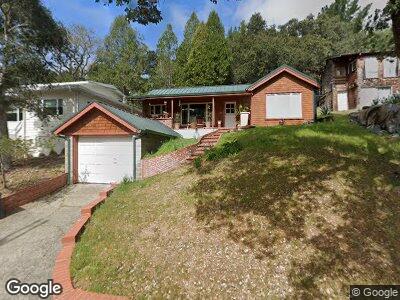
284 Cascade Dr Fairfax, CA 94930
Fairfax NeighborhoodEstimated Value: $871,453 - $998,000
2
Beds
1
Bath
1,002
Sq Ft
$933/Sq Ft
Est. Value
About This Home
This home is located at 284 Cascade Dr, Fairfax, CA 94930 and is currently estimated at $934,863, approximately $932 per square foot. 284 Cascade Dr is a home located in Marin County with nearby schools including Manor Elementary School, White Hill Middle School, and Archie Williams High School.
Ownership History
Date
Name
Owned For
Owner Type
Purchase Details
Closed on
May 23, 2008
Sold by
Gabel Joann S and Gabel Joann Schwebach
Bought by
Gabel Joann S
Current Estimated Value
Home Financials for this Owner
Home Financials are based on the most recent Mortgage that was taken out on this home.
Original Mortgage
$417,000
Interest Rate
5.87%
Mortgage Type
Stand Alone Refi Refinance Of Original Loan
Purchase Details
Closed on
May 9, 2005
Sold by
Gabel Gregory Leonard
Bought by
Gabel Johnn Schwebach
Home Financials for this Owner
Home Financials are based on the most recent Mortgage that was taken out on this home.
Original Mortgage
$100,000
Interest Rate
5.65%
Mortgage Type
Credit Line Revolving
Create a Home Valuation Report for This Property
The Home Valuation Report is an in-depth analysis detailing your home's value as well as a comparison with similar homes in the area
Home Values in the Area
Average Home Value in this Area
Purchase History
| Date | Buyer | Sale Price | Title Company |
|---|---|---|---|
| Gabel Joann S | -- | Old Republic Title Company | |
| Gabel Johnn Schwebach | -- | Fidelity National Title Co |
Source: Public Records
Mortgage History
| Date | Status | Borrower | Loan Amount |
|---|---|---|---|
| Closed | Gabel Joann S | $306,700 | |
| Closed | Gabel Joann S | $392,702 | |
| Closed | Gabel Joann S | $417,000 | |
| Closed | Gabel Joann S | $417,000 | |
| Closed | Gabel Joann Schwebach | $100,000 | |
| Closed | Gabel Johnn Schwebach | $434,500 | |
| Closed | Gabel Gregory Leonard | $100,000 | |
| Closed | Gabel Gregory Leonard | $189,000 | |
| Closed | Gabel Gregory Leonard | $157,250 |
Source: Public Records
Tax History Compared to Growth
Tax History
| Year | Tax Paid | Tax Assessment Tax Assessment Total Assessment is a certain percentage of the fair market value that is determined by local assessors to be the total taxable value of land and additions on the property. | Land | Improvement |
|---|---|---|---|---|
| 2024 | $5,362 | $281,465 | $103,204 | $178,261 |
| 2023 | $5,266 | $275,946 | $101,180 | $174,766 |
| 2022 | $5,170 | $270,536 | $99,196 | $171,340 |
| 2021 | $5,032 | $265,232 | $97,252 | $167,980 |
| 2020 | $4,936 | $262,514 | $96,255 | $166,259 |
| 2019 | $4,695 | $257,367 | $94,368 | $162,999 |
| 2018 | $4,606 | $252,320 | $92,517 | $159,803 |
| 2017 | $4,495 | $247,374 | $90,704 | $156,670 |
| 2016 | $4,284 | $242,524 | $88,925 | $153,599 |
| 2015 | $4,240 | $238,881 | $87,590 | $151,291 |
| 2014 | $3,985 | $234,202 | $85,874 | $148,328 |
Source: Public Records