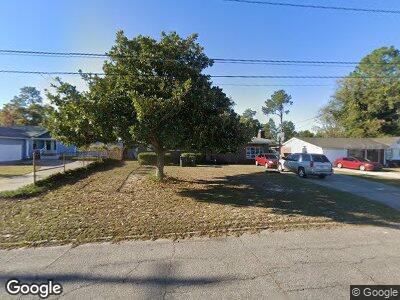
2859 Wells Dr Augusta, GA 30906
Richmond Hill NeighborhoodEstimated Value: $120,000 - $128,698
2
Beds
2
Baths
1,566
Sq Ft
$80/Sq Ft
Est. Value
About This Home
This home is located at 2859 Wells Dr, Augusta, GA 30906 and is currently estimated at $124,675, approximately $79 per square foot. 2859 Wells Dr is a home located in Richmond County with nearby schools including Wheeless Road Elementary School, Murphey Middle School, and Johnson Magnet.
Ownership History
Date
Name
Owned For
Owner Type
Purchase Details
Closed on
Oct 12, 2022
Sold by
Garcia Maria D Cruz
Bought by
Macedo Jaimes Gabriel and Cruz Garcia Maria
Current Estimated Value
Purchase Details
Closed on
Oct 2, 2019
Sold by
Giang David Kim
Bought by
Cruz-Garcia Maria De Lourdes
Purchase Details
Closed on
Jun 21, 2018
Sold by
Jpmorgan Chase Bank National Association
Bought by
Giang David Kim
Purchase Details
Closed on
Jan 2, 2018
Sold by
Napier Daniel J
Bought by
Jpmorgan Chase Bank National A
Purchase Details
Closed on
Apr 2, 2007
Sold by
Kirkland William C and Kirkland Phyllis L
Bought by
Napier Daniel J
Home Financials for this Owner
Home Financials are based on the most recent Mortgage that was taken out on this home.
Original Mortgage
$70,887
Interest Rate
6.15%
Mortgage Type
FHA
Purchase Details
Closed on
Jan 27, 1998
Sold by
Kirkland William C
Bought by
Kirkland William C and Kirkland Phyllis L
Create a Home Valuation Report for This Property
The Home Valuation Report is an in-depth analysis detailing your home's value as well as a comparison with similar homes in the area
Home Values in the Area
Average Home Value in this Area
Purchase History
| Date | Buyer | Sale Price | Title Company |
|---|---|---|---|
| Macedo Jaimes Gabriel | -- | -- | |
| Cruz-Garcia Maria De Lourdes | -- | -- | |
| Giang David Kim | $45,100 | -- | |
| Jpmorgan Chase Bank National A | -- | -- | |
| Napier Daniel J | $72,000 | None Available | |
| Kirkland William C | -- | -- |
Source: Public Records
Mortgage History
| Date | Status | Borrower | Loan Amount |
|---|---|---|---|
| Previous Owner | Napier Daniel J | $70,887 |
Source: Public Records
Tax History Compared to Growth
Tax History
| Year | Tax Paid | Tax Assessment Tax Assessment Total Assessment is a certain percentage of the fair market value that is determined by local assessors to be the total taxable value of land and additions on the property. | Land | Improvement |
|---|---|---|---|---|
| 2024 | $1,626 | $45,692 | $5,600 | $40,092 |
| 2023 | $1,626 | $52,556 | $5,600 | $46,956 |
| 2022 | $1,606 | $43,227 | $5,600 | $37,627 |
| 2021 | $1,354 | $31,187 | $5,600 | $25,587 |
| 2020 | $1,336 | $31,187 | $5,600 | $25,587 |
| 2019 | $1,405 | $31,187 | $5,600 | $25,587 |
| 2018 | $1,250 | $31,187 | $5,600 | $25,587 |
| 2017 | $1,194 | $31,187 | $5,600 | $25,587 |
| 2016 | $1,194 | $31,187 | $5,600 | $25,587 |
| 2015 | $1,202 | $31,187 | $5,600 | $25,587 |
| 2014 | $1,157 | $29,792 | $5,600 | $24,192 |
Source: Public Records
Map
Nearby Homes
- 2438 Young Dr
- 2533 Lyman St
- 2537 Lyman St
- 2558 Lyman St
- 2531 Norton Blvd
- 2567 Lyman St
- 2514 Lumpkin Rd
- 3085 Lumpkin Park Dr
- 2941 Shelby Dr
- 3010 Acorn Rd
- 2629 Richmond Hill Rd
- 2438 Ridge Rd
- 2905 Rocky Creek Rd
- 2808 Richmond Hill Rd
- 552 Richmond Hill Rd W
- 2402 Antebellum Dr
- 2430 Ridge Rd
- 2532 Richmond Hill Rd
- 2530 Richmond Hill Rd
- 2528 Richmond Hill Rd