Estimated Value: $337,000 - $377,000
3
Beds
1
Bath
1,816
Sq Ft
$199/Sq Ft
Est. Value
About This Home
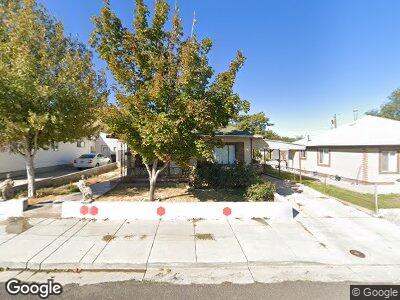
This home is located at 2872 S 9050 W, Magna, UT 84044 and is currently estimated at $360,972, approximately $198 per square foot. 2872 S 9050 W is a home located in Salt Lake County with nearby schools including Magna Elementary School, Matheson Junior High School, and Cyprus High School.
Ownership History
Date
Name
Owned For
Owner Type
Purchase Details
Closed on
May 20, 2022
Sold by
Martinez Troy L
Bought by
Horsley-Updike Aleah H and Updike Brian J
Current Estimated Value
Home Financials for this Owner
Home Financials are based on the most recent Mortgage that was taken out on this home.
Original Mortgage
$380,000
Outstanding Balance
$365,063
Interest Rate
5.25%
Mortgage Type
New Conventional
Estimated Equity
$3,575
Purchase Details
Closed on
May 19, 2022
Sold by
Martinez Troy L
Bought by
Horsley-Updike Aleah H and Updike Brian J
Home Financials for this Owner
Home Financials are based on the most recent Mortgage that was taken out on this home.
Original Mortgage
$380,000
Outstanding Balance
$365,063
Interest Rate
5.25%
Mortgage Type
New Conventional
Estimated Equity
$3,575
Purchase Details
Closed on
Feb 13, 2009
Sold by
Martinez Tommy
Bought by
Martinez Troy L
Purchase Details
Closed on
Aug 14, 1996
Sold by
Us Title
Bought by
Halliday Paul M
Create a Home Valuation Report for This Property
The Home Valuation Report is an in-depth analysis detailing your home's value as well as a comparison with similar homes in the area
Home Values in the Area
Average Home Value in this Area
Purchase History
| Date | Buyer | Sale Price | Title Company |
|---|---|---|---|
| Horsley-Updike Aleah H | -- | Eagle Gate Title Insurance Agc | |
| Horsley-Updike Aleah H | -- | Eagle Gate Title Insurance Agc | |
| Martinez Troy L | -- | None Available |
Source: Public Records
Mortgage History
| Date | Status | Borrower | Loan Amount |
|---|---|---|---|
| Open | Horsley-Updike Aleah H | $380,000 | |
| Closed | Horsley-Updike Aleah H | $380,000 |
Source: Public Records
Tax History Compared to Growth
Tax History
| Year | Tax Paid | Tax Assessment Tax Assessment Total Assessment is a certain percentage of the fair market value that is determined by local assessors to be the total taxable value of land and additions on the property. | Land | Improvement |
|---|---|---|---|---|
| 2023 | $2,274 | $290,300 | $88,200 | $202,100 |
| 2022 | $1,679 | $217,300 | $60,900 | $156,400 |
| 2021 | $1,622 | $183,500 | $46,900 | $136,600 |
| 2020 | $1,554 | $163,300 | $42,600 | $120,700 |
| 2019 | $1,461 | $149,900 | $39,800 | $110,100 |
| 2018 | $0 | $148,100 | $39,800 | $108,300 |
| 2017 | $1,229 | $127,200 | $39,800 | $87,400 |
| 2016 | $1,015 | $106,500 | $36,000 | $70,500 |
| 2015 | $979 | $98,600 | $42,000 | $56,600 |
| 2014 | $907 | $89,000 | $38,500 | $50,500 |
Source: Public Records
Map
Nearby Homes
- 2814 S 9100 W
- 2812 S 9150 W
- 3011 S 9050 W
- 2959 S 9200 W
- 2880 S 8900 W
- 2740 S 8900 W
- 8911 W 3000 S
- 2686 S 8850 W
- 2778 S Cyprus Ln
- 3251 S 9200 W
- 2877 Buccaneer Dr
- 2831 S Buccaneer Dr
- 2771 S Buccaneer Dr
- 2620 S 8590 W
- 2624 S 8550 W Unit 8
- 2618 S 8550 W
- 2859 S 8500 W
- 8640 W Helen Dr
- 2612 S 8550 W
- 3478 S Hackberry Place