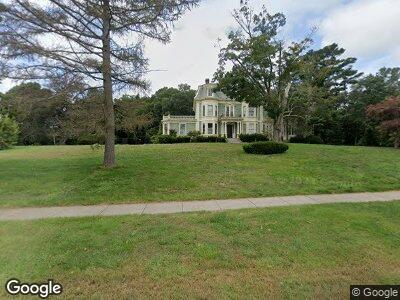
289 Walpole St Norwood, MA 02062
North Norwood NeighborhoodEstimated Value: $1,746,000 - $2,088,000
9
Beds
7
Baths
5,500
Sq Ft
$357/Sq Ft
Est. Value
About This Home
This home is located at 289 Walpole St, Norwood, MA 02062 and is currently estimated at $1,961,106, approximately $356 per square foot. 289 Walpole St is a home located in Norfolk County with nearby schools including Norwood High School, Norwood Montessori School, and St Catherine Of Siena School.
Ownership History
Date
Name
Owned For
Owner Type
Purchase Details
Closed on
Jul 14, 2020
Sold by
Pegurri Robert J and Rand Barbara J
Bought by
Invest Llc
Current Estimated Value
Purchase Details
Closed on
Jul 13, 1978
Bought by
Pegurri Robert J and Rand Barbara J
Create a Home Valuation Report for This Property
The Home Valuation Report is an in-depth analysis detailing your home's value as well as a comparison with similar homes in the area
Home Values in the Area
Average Home Value in this Area
Purchase History
| Date | Buyer | Sale Price | Title Company |
|---|---|---|---|
| Invest Llc | $1,400,000 | None Available | |
| Pegurri Robert J | $100,000 | -- |
Source: Public Records
Mortgage History
| Date | Status | Borrower | Loan Amount |
|---|---|---|---|
| Open | Invest Llc | $750,000 | |
| Closed | Invest Llc | $500,000 | |
| Previous Owner | Pegurri Robert J | $400,000 |
Source: Public Records
Tax History Compared to Growth
Tax History
| Year | Tax Paid | Tax Assessment Tax Assessment Total Assessment is a certain percentage of the fair market value that is determined by local assessors to be the total taxable value of land and additions on the property. | Land | Improvement |
|---|---|---|---|---|
| 2025 | $204 | $1,941,400 | $385,600 | $1,555,800 |
| 2024 | $19,427 | $1,855,500 | $385,600 | $1,469,900 |
| 2023 | $18,631 | $1,805,300 | $335,400 | $1,469,900 |
| 2022 | $18,364 | $1,708,300 | $306,200 | $1,402,100 |
| 2021 | $15,563 | $1,372,400 | $295,700 | $1,076,700 |
| 2020 | $14,554 | $1,305,300 | $295,700 | $1,009,600 |
| 2019 | $13,041 | $1,197,500 | $282,200 | $915,300 |
| 2018 | $13,141 | $1,184,900 | $269,600 | $915,300 |
| 2017 | $11,770 | $1,055,600 | $269,600 | $786,000 |
| 2016 | $10,563 | $949,900 | $269,600 | $680,300 |
| 2015 | $10,776 | $939,500 | $258,100 | $681,400 |
| 2014 | $10,515 | $908,000 | $235,600 | $672,400 |
Source: Public Records
Map
Nearby Homes
- 57 Hillshire Ln
- 58 Woodbine Rd
- 7 Endicott St Unit 6
- 70 Endicott St Unit 1106
- 70 Endicott St Unit 1601
- 70 Endicott St Unit 408
- 70 Endicott St Unit 901
- 70 Endicott St Unit 405
- 490 Nichols St
- 41 Chapel Ct
- 17 Chatham Rd
- 19 Chatham Rd
- 0 Fairview Rd
- 72 Devon Rd
- 82 Bond St
- 36 Saint George Ave Unit 2
- 3 Greenwich Rd
- 0 Baker Ave
- 46 River St
- 53 Beech St