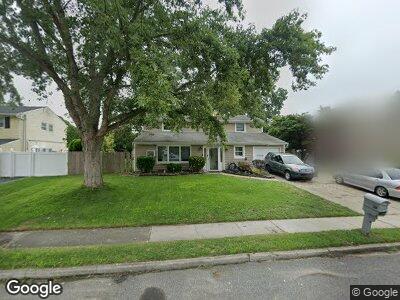
29 Fairlane Dr Selden, NY 11784
Selden NeighborhoodEstimated Value: $602,000 - $643,237
5
Beds
2
Baths
1,926
Sq Ft
$323/Sq Ft
Est. Value
About This Home
This home is located at 29 Fairlane Dr, Selden, NY 11784 and is currently estimated at $622,619, approximately $323 per square foot. 29 Fairlane Dr is a home located in Suffolk County with nearby schools including Our Savior New American School.
Ownership History
Date
Name
Owned For
Owner Type
Purchase Details
Closed on
Feb 16, 2019
Sold by
Stinsman Thomas and Stinsman Michelle L
Bought by
Stinsman Thomas
Current Estimated Value
Purchase Details
Closed on
Dec 11, 2015
Sold by
Stinsman Thomas
Bought by
Stinsman Thomas and Stinsman Michelle Lisa
Home Financials for this Owner
Home Financials are based on the most recent Mortgage that was taken out on this home.
Original Mortgage
$199,500
Interest Rate
3.21%
Mortgage Type
New Conventional
Purchase Details
Closed on
Nov 20, 2003
Sold by
Coffey Robert and Coffey Donna A
Bought by
Stinsman Thomas
Home Financials for this Owner
Home Financials are based on the most recent Mortgage that was taken out on this home.
Original Mortgage
$268,400
Interest Rate
6.03%
Mortgage Type
Purchase Money Mortgage
Purchase Details
Closed on
Aug 24, 1994
Sold by
Defazio Joan P and Defazio Michael
Bought by
Coffey Robert and Coffey Donna A
Create a Home Valuation Report for This Property
The Home Valuation Report is an in-depth analysis detailing your home's value as well as a comparison with similar homes in the area
Home Values in the Area
Average Home Value in this Area
Purchase History
| Date | Buyer | Sale Price | Title Company |
|---|---|---|---|
| Stinsman Thomas | -- | -- | |
| Stinsman Thomas | -- | None Available | |
| Stinsman Thomas | $335,500 | The Judicial Title Ins Agenc |
Source: Public Records
Mortgage History
| Date | Status | Borrower | Loan Amount |
|---|---|---|---|
| Previous Owner | Stinsma Thomas | $240,000 | |
| Previous Owner | Stinsman Thomas | $199,500 | |
| Previous Owner | Stinsman Thomas | $239,782 | |
| Previous Owner | Stinsman Thomas | $268,400 | |
| Previous Owner | Stinsman Thomas | $47,100 | |
| Previous Owner | Coffey Robert | $145,000 | |
| Previous Owner | Coffey Robert | $122,800 |
Source: Public Records
Tax History Compared to Growth
Tax History
| Year | Tax Paid | Tax Assessment Tax Assessment Total Assessment is a certain percentage of the fair market value that is determined by local assessors to be the total taxable value of land and additions on the property. | Land | Improvement |
|---|---|---|---|---|
| 2023 | $10,903 | $2,615 | $225 | $2,390 |
| 2022 | $9,699 | $2,615 | $225 | $2,390 |
| 2021 | $9,699 | $2,615 | $225 | $2,390 |
| 2020 | $9,943 | $2,615 | $225 | $2,390 |
| 2019 | $9,943 | $0 | $0 | $0 |
| 2018 | $9,482 | $2,615 | $225 | $2,390 |
| 2017 | $9,482 | $2,615 | $225 | $2,390 |
| 2016 | $9,456 | $2,615 | $225 | $2,390 |
| 2015 | -- | $2,615 | $225 | $2,390 |
| 2014 | -- | $2,615 | $225 | $2,390 |
Source: Public Records
Map
Nearby Homes
- 62 King Ave
- 124 Alma Ave
- 27 Campo Ave
- 106 Alma Ave
- 48 Henry Ave
- 25 Alma Ave
- 67 Selden Blvd
- 98 Smithtown Polk Blvd
- 34 Nelson Rd
- 14 Farner Ave
- 495 Hawkins Rd
- 12 Farner Ave
- 0 N Coleman Rd Unit ONE3546700
- 39 Carston St
- 12 Fountain Ave
- 6 Capri Rd
- 88 N Coleman Rd
- 8 Remington Ave
- 30 Brookfield Ln
- 5 Marlin Rd