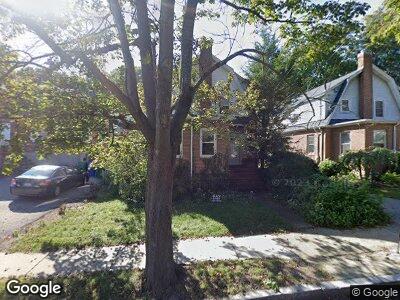
29 Margaret Rd Newton Highlands, MA 02461
Newton Highlands NeighborhoodEstimated Value: $947,000 - $1,169,811
3
Beds
3
Baths
1,568
Sq Ft
$650/Sq Ft
Est. Value
About This Home
This home is located at 29 Margaret Rd, Newton Highlands, MA 02461 and is currently estimated at $1,018,703, approximately $649 per square foot. 29 Margaret Rd is a home located in Middlesex County with nearby schools including Zervas Elementary School, Oak Hill Middle School, and Newton South High School.
Ownership History
Date
Name
Owned For
Owner Type
Purchase Details
Closed on
Jul 1, 2003
Sold by
Goldstein Lyla Y and Goldstein Matthew A
Bought by
Goldstein Lyla Y and Goldstein Matthew A
Current Estimated Value
Home Financials for this Owner
Home Financials are based on the most recent Mortgage that was taken out on this home.
Original Mortgage
$200,000
Interest Rate
5.53%
Purchase Details
Closed on
Apr 15, 1999
Sold by
Olia Masoud and Olia Maria
Bought by
Yee Lyla and Goldstein Matthew A
Home Financials for this Owner
Home Financials are based on the most recent Mortgage that was taken out on this home.
Original Mortgage
$215,000
Interest Rate
7.04%
Mortgage Type
Purchase Money Mortgage
Purchase Details
Closed on
Feb 16, 1990
Sold by
Kevlin Janet C
Bought by
Olia Masoud
Home Financials for this Owner
Home Financials are based on the most recent Mortgage that was taken out on this home.
Original Mortgage
$146,250
Interest Rate
9.69%
Mortgage Type
Purchase Money Mortgage
Create a Home Valuation Report for This Property
The Home Valuation Report is an in-depth analysis detailing your home's value as well as a comparison with similar homes in the area
Home Values in the Area
Average Home Value in this Area
Purchase History
| Date | Buyer | Sale Price | Title Company |
|---|---|---|---|
| Goldstein Lyla Y | -- | -- | |
| Yee Lyla | $273,500 | -- | |
| Olia Masoud | $162,500 | -- |
Source: Public Records
Mortgage History
| Date | Status | Borrower | Loan Amount |
|---|---|---|---|
| Open | Goldstein Matthew A | $300,000 | |
| Closed | Goldstein Lyla Y | $200,000 | |
| Previous Owner | Olia Masoud | $215,000 | |
| Previous Owner | Olia Masoud | $135,092 | |
| Previous Owner | Olia Masoud | $146,250 |
Source: Public Records
Tax History Compared to Growth
Tax History
| Year | Tax Paid | Tax Assessment Tax Assessment Total Assessment is a certain percentage of the fair market value that is determined by local assessors to be the total taxable value of land and additions on the property. | Land | Improvement |
|---|---|---|---|---|
| 2025 | $8,164 | $833,100 | $816,300 | $16,800 |
| 2024 | $7,894 | $808,800 | $792,500 | $16,300 |
| 2023 | $7,525 | $739,200 | $588,500 | $150,700 |
| 2022 | $7,200 | $684,400 | $544,900 | $139,500 |
| 2021 | $0 | $645,700 | $514,100 | $131,600 |
| 2020 | $7,278 | $645,700 | $514,100 | $131,600 |
| 2019 | $6,551 | $626,900 | $499,100 | $127,800 |
| 2018 | $7,153 | $575,700 | $449,500 | $126,200 |
| 2017 | $6,039 | $543,100 | $424,100 | $119,000 |
| 2016 | $5,776 | $507,600 | $396,400 | $111,200 |
| 2015 | $5,508 | $474,400 | $370,500 | $103,900 |
Source: Public Records
Map
Nearby Homes
- 73 Roundwood Rd
- 15 Thurston Rd Unit 15
- 1077 Boylston St Unit 1077
- 120 Dickerman Rd
- 168 Elliot St
- 54 Woodward St
- 103 Thurston Rd
- 95 Erie Ave
- 169 Dickerman Rd
- 71 Erie Ave Unit 2
- 66 Rockland Place
- 241 Elliot St Unit 1
- 126 Lincoln St Unit 1
- 17 Cochituate Rd
- 302 Elliot St Carriage House N Unit 3
- 304 Elliot St Carriage House S Unit 4
- 300 Elliot St Unit 2
- 72 Lincoln St Unit 10