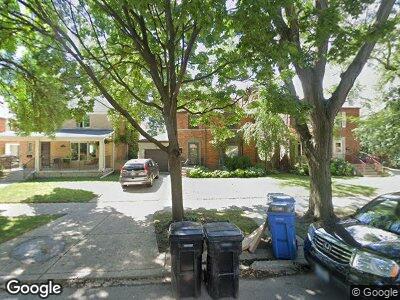
2919 W Morse Ave Chicago, IL 60645
West Ridge NeighborhoodEstimated Value: $742,028 - $933,000
4
Beds
3
Baths
2,709
Sq Ft
$312/Sq Ft
Est. Value
About This Home
This home is located at 2919 W Morse Ave, Chicago, IL 60645 and is currently estimated at $846,507, approximately $312 per square foot. 2919 W Morse Ave is a home located in Cook County with nearby schools including West Ridge Elementary School, Mather High School, and Bethesda International Academy.
Ownership History
Date
Name
Owned For
Owner Type
Purchase Details
Closed on
Jul 11, 1995
Sold by
Levine Lawrence M and Levine Peggy R
Bought by
Rosenwasser James S and Rosenwasser Ateret S
Current Estimated Value
Home Financials for this Owner
Home Financials are based on the most recent Mortgage that was taken out on this home.
Original Mortgage
$123,000
Interest Rate
7.79%
Create a Home Valuation Report for This Property
The Home Valuation Report is an in-depth analysis detailing your home's value as well as a comparison with similar homes in the area
Home Values in the Area
Average Home Value in this Area
Purchase History
| Date | Buyer | Sale Price | Title Company |
|---|---|---|---|
| Rosenwasser James S | $173,000 | -- |
Source: Public Records
Mortgage History
| Date | Status | Borrower | Loan Amount |
|---|---|---|---|
| Open | Rosenwasser James S | $172,000 | |
| Closed | Rosenwasser James S | $225,000 | |
| Closed | Rosenwasser James S | $325,000 | |
| Closed | Rosenwasser James S | $322,700 | |
| Closed | Rosenwasser James S | $75,000 | |
| Closed | Rosenwasser James S | $275,000 | |
| Closed | Rosenwasser James S | $60,000 | |
| Closed | Rosenwasser James S | $317,000 | |
| Closed | Rosenwasser James S | $100,000 | |
| Closed | Rosenwasser James | $216,000 | |
| Closed | Rosenwasser James S | $123,000 |
Source: Public Records
Tax History Compared to Growth
Tax History
| Year | Tax Paid | Tax Assessment Tax Assessment Total Assessment is a certain percentage of the fair market value that is determined by local assessors to be the total taxable value of land and additions on the property. | Land | Improvement |
|---|---|---|---|---|
| 2024 | $11,930 | $76,001 | $13,068 | $62,933 |
| 2023 | $11,930 | $58,000 | $10,454 | $47,546 |
| 2022 | $11,930 | $58,000 | $10,454 | $47,546 |
| 2021 | $11,663 | $58,000 | $10,454 | $47,546 |
| 2020 | $12,889 | $57,858 | $7,579 | $50,279 |
| 2019 | $12,988 | $64,646 | $7,579 | $57,067 |
| 2018 | $12,770 | $64,646 | $7,579 | $57,067 |
| 2017 | $9,565 | $44,434 | $6,795 | $37,639 |
| 2016 | $8,900 | $44,434 | $6,795 | $37,639 |
| 2015 | $8,142 | $44,434 | $6,795 | $37,639 |
| 2014 | $8,270 | $44,574 | $6,272 | $38,302 |
| 2013 | $8,107 | $44,574 | $6,272 | $38,302 |
Source: Public Records
Map
Nearby Homes
- 6800 N California Ave Unit 4Q
- 2810 W Lunt Ave
- 7061 N Kedzie Ave Unit 1409
- 7061 N Kedzie Ave Unit 1001
- 7061 N Kedzie Ave Unit 312
- 7061 N Kedzie Ave Unit 813
- 6700 N Fairfield Ave
- 6933 N Kedzie Ave Unit 116
- 6933 N Kedzie Ave Unit 305
- 6933 N Kedzie Ave Unit 117
- 6833 N Kedzie Ave Unit 1209
- 6833 N Kedzie Ave Unit 709
- 6833 N Kedzie Ave Unit 1010
- 6833 N Kedzie Ave Unit 306
- 6833 N Kedzie Ave Unit 1216
- 2656 W Coyle Ave
- 7033 N Kedzie Ave Unit 504
- 7033 N Kedzie Ave Unit 1201
- 7033 N Kedzie Ave Unit 1713
- 7033 N Kedzie Ave Unit 1704