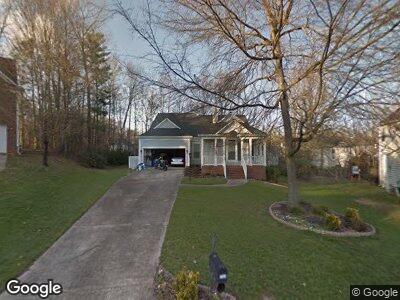
2932 Canary Ct Charlotte, NC 28269
Highland Creek NeighborhoodEstimated Value: $383,000 - $411,000
4
Beds
3
Baths
1,891
Sq Ft
$209/Sq Ft
Est. Value
About This Home
This home is located at 2932 Canary Ct, Charlotte, NC 28269 and is currently estimated at $395,342, approximately $209 per square foot. 2932 Canary Ct is a home located in Mecklenburg County with nearby schools including Parkside Elementary School, Ridge Road Middle School, and Mallard Creek High School.
Ownership History
Date
Name
Owned For
Owner Type
Purchase Details
Closed on
Jun 28, 2006
Sold by
Stephens Michael Lynn and Stephens Michelle Clontz
Bought by
Pecenco Brian F and Pecenco Patricia A
Current Estimated Value
Home Financials for this Owner
Home Financials are based on the most recent Mortgage that was taken out on this home.
Original Mortgage
$132,000
Outstanding Balance
$82,411
Interest Rate
6.75%
Mortgage Type
Purchase Money Mortgage
Estimated Equity
$319,837
Purchase Details
Closed on
Mar 18, 2003
Sold by
Federal Home Loan Mortgage Corporation
Bought by
Stephens Michael Lynn and Clontz Michelle Denise
Home Financials for this Owner
Home Financials are based on the most recent Mortgage that was taken out on this home.
Original Mortgage
$130,336
Interest Rate
5.86%
Mortgage Type
Purchase Money Mortgage
Purchase Details
Closed on
Aug 27, 2002
Sold by
Dalenburg Adam J and Dalenburg Jennifer N
Bought by
Federal Home Loan Mortgage Corporation
Create a Home Valuation Report for This Property
The Home Valuation Report is an in-depth analysis detailing your home's value as well as a comparison with similar homes in the area
Home Values in the Area
Average Home Value in this Area
Purchase History
| Date | Buyer | Sale Price | Title Company |
|---|---|---|---|
| Pecenco Brian F | $165,000 | None Available | |
| Stephens Michael Lynn | -- | -- | |
| Federal Home Loan Mortgage Corporation | $141,300 | -- |
Source: Public Records
Mortgage History
| Date | Status | Borrower | Loan Amount |
|---|---|---|---|
| Open | Pecenco Brian F | $80,000 | |
| Closed | Pecenco Brian F | $65,000 | |
| Open | Pecenco Brian F | $132,000 | |
| Closed | Pecenco Brian F | $16,500 | |
| Previous Owner | Stephens Michael Lynn | $130,336 | |
| Previous Owner | Dalenburg Adam J | $142,300 |
Source: Public Records
Tax History Compared to Growth
Tax History
| Year | Tax Paid | Tax Assessment Tax Assessment Total Assessment is a certain percentage of the fair market value that is determined by local assessors to be the total taxable value of land and additions on the property. | Land | Improvement |
|---|---|---|---|---|
| 2023 | $2,188 | $399,700 | $80,000 | $319,700 |
| 2022 | $2,188 | $226,700 | $50,000 | $176,700 |
| 2021 | $2,188 | $226,700 | $50,000 | $176,700 |
| 2020 | $2,188 | $226,700 | $50,000 | $176,700 |
| 2019 | $2,279 | $226,700 | $50,000 | $176,700 |
| 2018 | $2,037 | $149,700 | $30,000 | $119,700 |
| 2017 | $2,001 | $149,700 | $30,000 | $119,700 |
| 2016 | $1,991 | $149,700 | $30,000 | $119,700 |
| 2015 | $1,980 | $149,700 | $30,000 | $119,700 |
| 2014 | $1,985 | $0 | $0 | $0 |
Source: Public Records
Map
Nearby Homes
- 11841 Mourning Dove Ln
- 11913 Little Stoney Ct
- 2705 Towhee Ct
- 1916 Highland Park Dr
- 316 Lawrence Gray Rd
- 1938 Grace Ln
- 9020 Northfield Crossing Dr
- 3209 Lilac Grove Dr
- 3213 Lilac Grove Dr
- 3217 Lilac Grove Dr
- 3205 Lilac Grove Dr
- 3201 Lilac Grove Dr
- 3164 Lilac Grove Dr
- 3168 Lilac Grove Dr
- 7016 Bentz St
- 4009 Lawnview Dr
- 1904 Highland Park Dr
- 1908 Highland Park Dr
- 3172 Lilac Grove Dr
- 3160 Lilac Grove Dr