
Seller's Agent in 2025
Ted Fairchild
Sunrise Realty & Investment LLC
(617) 631-8724
6 Total Sales
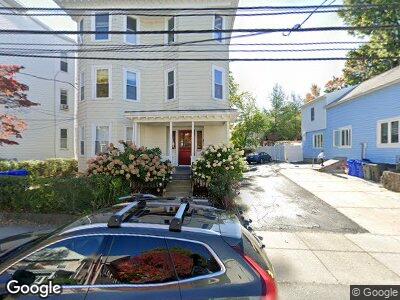
May 1 occupancy. Great, vibrant location. Brighton / Brookline border. Steps to Whole Foods, Washington Square. 3BR 1.5 BA. Spacious living room, eat in kitchen. In-Unit washer/dryer. Central air and heat. Hardwood floors throughout and bathroom updates (pics are from 2 years ago). Bonus room for storage/study/guest space. Equal-sized bedrooms with good closet space. 1 (possibly 2) off-street parking spot for $150/month.
| Date | Buyer | Sale Price | Title Company |
|---|---|---|---|
| Youshaei David | -- | -- | |
| Youshaei David | -- | -- | |
| Youshaei David | $525,000 | -- |
| Date | Status | Borrower | Loan Amount |
|---|---|---|---|
| Open | Youshaei David | $304,200 | |
| Previous Owner | Youshaei David R | $335,899 | |
| Previous Owner | Youshaei David | $250,000 | |
| Previous Owner | Youshaei David | $420,000 |
| Date | Event | Price | Change | Sq Ft Price |
|---|---|---|---|---|
| 03/25/2025 03/25/25 | Rented | $3,700 | 0.0% | -- |
| 03/24/2025 03/24/25 | Under Contract | -- | -- | -- |
| 03/16/2025 03/16/25 | For Rent | $3,700 | +13.8% | -- |
| 05/07/2023 05/07/23 | Rented | $3,250 | 0.0% | -- |
| 05/05/2023 05/05/23 | Under Contract | -- | -- | -- |
| 04/25/2023 04/25/23 | For Rent | $3,250 | -- | -- |
| Year | Tax Paid | Tax Assessment Tax Assessment Total Assessment is a certain percentage of the fair market value that is determined by local assessors to be the total taxable value of land and additions on the property. | Land | Improvement |
|---|---|---|---|---|
| 2025 | $24,305 | $2,098,900 | $650,400 | $1,448,500 |
| 2024 | $20,457 | $1,876,800 | $416,500 | $1,460,300 |
| 2023 | $19,188 | $1,786,600 | $396,400 | $1,390,200 |
| 2022 | $19,250 | $1,769,300 | $392,600 | $1,376,700 |
| 2021 | $18,032 | $1,690,000 | $384,900 | $1,305,100 |
| 2020 | $16,187 | $1,532,900 | $370,900 | $1,162,000 |
| 2019 | $15,106 | $1,433,200 | $280,800 | $1,152,400 |
| 2018 | $14,071 | $1,342,700 | $280,800 | $1,061,900 |
| 2017 | $13,542 | $1,278,800 | $280,800 | $998,000 |
| 2016 | $12,560 | $1,141,800 | $280,800 | $861,000 |
| 2015 | $12,145 | $1,002,900 | $270,800 | $732,100 |
| 2014 | $10,962 | $871,400 | $270,800 | $600,600 |
Seller's Agent in 2025
Ted Fairchild
Sunrise Realty & Investment LLC
(617) 631-8724
6 Total Sales
S
Buyer's Agent in 2025
Shahab Madadi
Compass
(617) 206-3333
1 Total Sale
Buyer's Agent in 2023
Wendy Shore
Berkshire Hathaway HomeServices Commonwealth Real Estate
(508) 944-5419
30 Total Sales