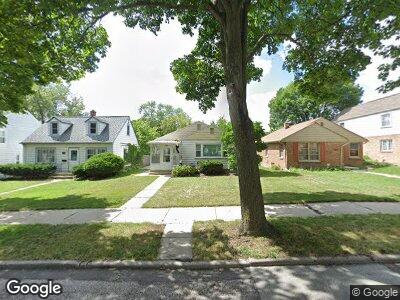
2963 N 90th St Milwaukee, WI 53222
Mount Mary NeighborhoodEstimated Value: $233,000 - $313,000
3
Beds
1
Bath
2,064
Sq Ft
$129/Sq Ft
Est. Value
About This Home
This home is located at 2963 N 90th St, Milwaukee, WI 53222 and is currently estimated at $266,823, approximately $129 per square foot. 2963 N 90th St is a home located in Milwaukee County with nearby schools including Eighty-First Street School, Milwaukee German Immersion School, and Craig Montessori School.
Ownership History
Date
Name
Owned For
Owner Type
Purchase Details
Closed on
May 27, 2021
Sold by
Immen Robert P and Immen Kathleen
Bought by
Immen Robert P and Immen Kathleen R
Current Estimated Value
Purchase Details
Closed on
Aug 21, 2019
Sold by
Onan Roby J and Onan Karen M
Bought by
Immen Robert P and Immen Kathleen
Home Financials for this Owner
Home Financials are based on the most recent Mortgage that was taken out on this home.
Original Mortgage
$182,150
Outstanding Balance
$163,606
Interest Rate
3.7%
Mortgage Type
New Conventional
Estimated Equity
$96,301
Purchase Details
Closed on
Sep 29, 2016
Sold by
Blake Jo Anne E
Bought by
Onan Roby J and Onan Karen M
Home Financials for this Owner
Home Financials are based on the most recent Mortgage that was taken out on this home.
Original Mortgage
$100,500
Interest Rate
3.43%
Mortgage Type
New Conventional
Create a Home Valuation Report for This Property
The Home Valuation Report is an in-depth analysis detailing your home's value as well as a comparison with similar homes in the area
Home Values in the Area
Average Home Value in this Area
Purchase History
| Date | Buyer | Sale Price | Title Company |
|---|---|---|---|
| Immen Robert P | -- | None Available | |
| Immen Robert P | $192,000 | Lakefront Title Llc | |
| Onan Roby J | $134,000 | None Available |
Source: Public Records
Mortgage History
| Date | Status | Borrower | Loan Amount |
|---|---|---|---|
| Open | Immen Robert P | $182,150 | |
| Previous Owner | Onan Roby J | $100,500 | |
| Previous Owner | Blake Jo Anne E | $143,580 | |
| Previous Owner | Blake Jo Anne E | $156,565 | |
| Previous Owner | Blake Jo Anne E | $32,000 |
Source: Public Records
Tax History Compared to Growth
Tax History
| Year | Tax Paid | Tax Assessment Tax Assessment Total Assessment is a certain percentage of the fair market value that is determined by local assessors to be the total taxable value of land and additions on the property. | Land | Improvement |
|---|---|---|---|---|
| 2023 | $4,206 | $178,000 | $17,100 | $160,900 |
| 2022 | $3,923 | $178,000 | $17,100 | $160,900 |
| 2021 | $3,786 | $156,100 | $17,100 | $139,000 |
| 2020 | $3,826 | $156,100 | $17,100 | $139,000 |
| 2019 | $3,390 | $138,100 | $18,400 | $119,700 |
| 2018 | $3,410 | $138,100 | $18,400 | $119,700 |
| 2017 | $3,320 | $124,300 | $21,400 | $102,900 |
| 2016 | $3,313 | $123,000 | $21,400 | $101,600 |
| 2015 | $3,293 | $119,400 | $21,400 | $98,000 |
| 2014 | $3,362 | $119,400 | $21,400 | $98,000 |
| 2013 | -- | $114,800 | $21,400 | $93,400 |
Source: Public Records
Map
Nearby Homes
- 8825 W Chambers St
- 2915 N 88th St
- 2834 N 89th St
- 3130 N 90th St
- 3137 N 90th St
- 3126 N 92nd St Unit 3128
- 3050 N 87th St
- 2969 N 85th St
- 9405 W Hadley St
- 3163 N 86th St
- 8802 W Center St
- 2642 N 90th St
- 9030 W Concordia Ave
- 2824 N 84th St
- 3043 N 83rd St
- 3250 N 95th St
- 3150 N 84th St
- 2803 N 83rd St
- 3223 N 84th St Unit 3225
- 2565 N 91st St