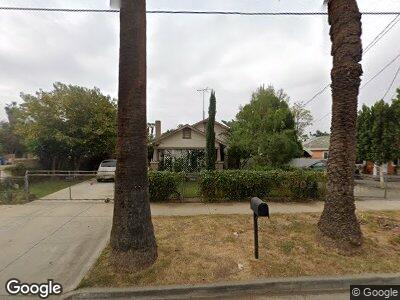
2968 4th St Riverside, CA 92507
Eastside NeighborhoodEstimated Value: $407,321 - $458,000
3
Beds
1
Bath
924
Sq Ft
$475/Sq Ft
Est. Value
About This Home
This home is located at 2968 4th St, Riverside, CA 92507 and is currently estimated at $439,080, approximately $475 per square foot. 2968 4th St is a home located in Riverside County with nearby schools including Longfellow Elementary School, University Heights Middle School, and Polytechnic High School.
Ownership History
Date
Name
Owned For
Owner Type
Purchase Details
Closed on
Dec 24, 2010
Sold by
Creech Robert and Creech Robert C
Bought by
Creech Robert C
Current Estimated Value
Purchase Details
Closed on
Sep 15, 2010
Sold by
Torres Juanita and Creech Robert
Bought by
Creech Robert
Purchase Details
Closed on
Oct 5, 2009
Sold by
Torres Juanita Lv
Bought by
Torres Juanita Lv and Creech Robert
Purchase Details
Closed on
Aug 1, 1994
Sold by
Torres Juanita Lv
Bought by
Torres Juanita L
Home Financials for this Owner
Home Financials are based on the most recent Mortgage that was taken out on this home.
Original Mortgage
$43,000
Interest Rate
8.51%
Mortgage Type
Purchase Money Mortgage
Purchase Details
Closed on
Jul 28, 1994
Sold by
Valdez Guillermo
Bought by
Torres Juanita Lv
Home Financials for this Owner
Home Financials are based on the most recent Mortgage that was taken out on this home.
Original Mortgage
$43,000
Interest Rate
8.51%
Mortgage Type
Purchase Money Mortgage
Create a Home Valuation Report for This Property
The Home Valuation Report is an in-depth analysis detailing your home's value as well as a comparison with similar homes in the area
Home Values in the Area
Average Home Value in this Area
Purchase History
| Date | Buyer | Sale Price | Title Company |
|---|---|---|---|
| Creech Robert C | -- | None Available | |
| Torres Juanita Lv | -- | None Available | |
| Torres Juanita L | -- | Northern Counties Title | |
| Torres Juanita Lv | -- | -- |
Source: Public Records
Mortgage History
| Date | Status | Borrower | Loan Amount |
|---|---|---|---|
| Closed | Torres Juanita L | $43,000 |
Source: Public Records
Tax History Compared to Growth
Tax History
| Year | Tax Paid | Tax Assessment Tax Assessment Total Assessment is a certain percentage of the fair market value that is determined by local assessors to be the total taxable value of land and additions on the property. | Land | Improvement |
|---|---|---|---|---|
| 2023 | $385 | $28,579 | $11,935 | $16,644 |
| 2022 | $378 | $28,019 | $11,701 | $16,318 |
| 2021 | $391 | $27,471 | $11,472 | $15,999 |
| 2020 | $389 | $27,190 | $11,355 | $15,835 |
| 2019 | $382 | $26,658 | $11,133 | $15,525 |
| 2018 | $376 | $26,136 | $10,915 | $15,221 |
| 2017 | $371 | $25,624 | $10,701 | $14,923 |
| 2016 | $352 | $25,123 | $10,492 | $14,631 |
| 2015 | $346 | $24,748 | $10,336 | $14,412 |
| 2014 | $342 | $24,266 | $10,135 | $14,131 |
Source: Public Records
Map
Nearby Homes
- 3496 Commerce St
- 2311 5th St
- 3335 3rd St
- 3560 Franklin Ave
- 2759 9th St
- 3150 Lime St
- 3049 Mulberry St
- 2125 7th St
- 2029 Patterson St
- 2190 9th St
- 2972 Orange St
- 4302 Park Ave
- 2431 12th St
- 3727 Springmount St
- 3852 4th St
- 3858 4th St
- 0 Arlington Ave Unit SW24165534
- 2192 12th St
- 1806 Loma Vista St
- 3392 Spruce St