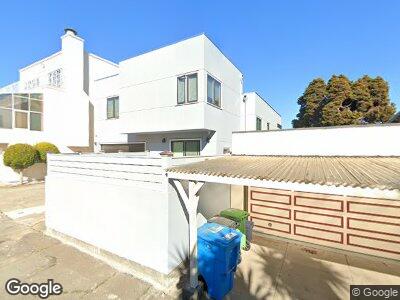
2989 23rd Ave San Francisco, CA 94132
Merced Manor NeighborhoodEstimated Value: $1,902,638 - $2,118,000
4
Beds
3
Baths
2,136
Sq Ft
$928/Sq Ft
Est. Value
About This Home
This home is located at 2989 23rd Ave, San Francisco, CA 94132 and is currently estimated at $1,981,910, approximately $927 per square foot. 2989 23rd Ave is a home located in San Francisco County with nearby schools including Lakeshore Alternative Elementary School, Denman (James) Middle School, and St. Stephen School.
Ownership History
Date
Name
Owned For
Owner Type
Purchase Details
Closed on
Jun 12, 2006
Sold by
K M S/Fishermans Wharf Lp
Bought by
Bayside Homes Llc
Current Estimated Value
Home Financials for this Owner
Home Financials are based on the most recent Mortgage that was taken out on this home.
Original Mortgage
$687,000
Interest Rate
6.76%
Mortgage Type
Construction
Purchase Details
Closed on
Aug 22, 1998
Sold by
Leona Greendorfer 1990 Trust and Greendorfer Leona
Bought by
Chan Jeff W and Chan Pui Lan
Home Financials for this Owner
Home Financials are based on the most recent Mortgage that was taken out on this home.
Original Mortgage
$464,000
Interest Rate
6.91%
Create a Home Valuation Report for This Property
The Home Valuation Report is an in-depth analysis detailing your home's value as well as a comparison with similar homes in the area
Home Values in the Area
Average Home Value in this Area
Purchase History
| Date | Buyer | Sale Price | Title Company |
|---|---|---|---|
| Bayside Homes Llc | $717,000 | Old Republic Title Company | |
| Chan Jeff W | $580,000 | Commonwealth Land Title Co |
Source: Public Records
Mortgage History
| Date | Status | Borrower | Loan Amount |
|---|---|---|---|
| Open | Chan Jeff W | $383,000 | |
| Closed | Chan Jeff W | $397,000 | |
| Closed | Chan Jeff W | $406,000 | |
| Previous Owner | Bayside Homes Llc | $687,000 | |
| Previous Owner | Chan Jeff W | $440,000 | |
| Previous Owner | Chan Jeff W | $464,000 |
Source: Public Records
Tax History Compared to Growth
Tax History
| Year | Tax Paid | Tax Assessment Tax Assessment Total Assessment is a certain percentage of the fair market value that is determined by local assessors to be the total taxable value of land and additions on the property. | Land | Improvement |
|---|---|---|---|---|
| 2024 | $12,446 | $1,002,105 | $461,083 | $541,022 |
| 2023 | $12,254 | $982,457 | $452,043 | $530,414 |
| 2022 | $12,013 | $963,195 | $443,180 | $520,015 |
| 2021 | $10,564 | $840,016 | $434,491 | $405,525 |
| 2020 | $10,620 | $831,403 | $430,036 | $401,367 |
| 2019 | $10,257 | $815,102 | $421,604 | $393,498 |
| 2018 | $9,911 | $799,121 | $413,338 | $385,783 |
| 2017 | $9,494 | $783,453 | $405,234 | $378,219 |
| 2016 | $9,327 | $768,092 | $397,289 | $370,803 |
| 2015 | $9,210 | $756,556 | $391,322 | $365,234 |
| 2014 | $8,966 | $741,737 | $383,657 | $358,080 |
Source: Public Records
Map
Nearby Homes
- 120 Paraiso Place
- 2790 19th Ave Unit 14
- 100 Stonecrest Dr
- 95 Junipero Serra Blvd
- 140 San Fernando Way
- 585 Junipero Serra Blvd
- 245 235 Gellert Dr
- 381 Wawona St
- 255 Santa Ana Ave
- 306 San Benito Way
- 2427 26th Ave
- 2418 21st Ave
- 2438 28th Ave
- 1496 Portola Dr
- 131 Morningside Dr
- 1640 Taraval St
- 1642 Taraval St
- 106 Aptos Ave
- 1644 Taraval St
- 2450 16th Ave