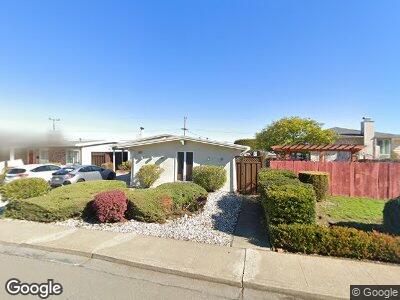
2991 Crestmoor Dr San Bruno, CA 94066
Crestmoor NeighborhoodEstimated Value: $1,260,000 - $1,412,221
3
Beds
2
Baths
1,150
Sq Ft
$1,167/Sq Ft
Est. Value
About This Home
This home is located at 2991 Crestmoor Dr, San Bruno, CA 94066 and is currently estimated at $1,342,055, approximately $1,167 per square foot. 2991 Crestmoor Dr is a home located in San Mateo County with nearby schools including John Muir Elementary School, Parkside Intermediate School, and Capuchino High School.
Ownership History
Date
Name
Owned For
Owner Type
Purchase Details
Closed on
Mar 14, 2024
Sold by
Inter-Vivo Jesse S Gultia 2008 Revocable and Gultia Jesse S
Bought by
Gultia Marilou S
Current Estimated Value
Purchase Details
Closed on
Feb 6, 2008
Sold by
Gultia Jesse S
Bought by
Gultia Jesse S
Purchase Details
Closed on
Sep 20, 2000
Sold by
Gultia Jesusito
Bought by
Gultia Barbara K
Home Financials for this Owner
Home Financials are based on the most recent Mortgage that was taken out on this home.
Original Mortgage
$80,000
Interest Rate
7.76%
Purchase Details
Closed on
Sep 13, 2000
Sold by
Johnson Carolyn E & E C Trs
Bought by
Gultia Barbara K
Home Financials for this Owner
Home Financials are based on the most recent Mortgage that was taken out on this home.
Original Mortgage
$80,000
Interest Rate
7.76%
Create a Home Valuation Report for This Property
The Home Valuation Report is an in-depth analysis detailing your home's value as well as a comparison with similar homes in the area
Home Values in the Area
Average Home Value in this Area
Purchase History
| Date | Buyer | Sale Price | Title Company |
|---|---|---|---|
| Gultia Marilou S | -- | None Listed On Document | |
| Gultia Jesse S | -- | None Available | |
| Gultia Barbara K | -- | Alliance Title | |
| Gultia Barbara K | $100,000 | Alliance Title |
Source: Public Records
Mortgage History
| Date | Status | Borrower | Loan Amount |
|---|---|---|---|
| Open | Gultia Marilou S | $400,000 | |
| Previous Owner | Gultia Jesse S | $100,000 | |
| Previous Owner | Gultia Barbara K | $77,000 | |
| Previous Owner | Gultia Barbara K | $80,000 |
Source: Public Records
Tax History Compared to Growth
Tax History
| Year | Tax Paid | Tax Assessment Tax Assessment Total Assessment is a certain percentage of the fair market value that is determined by local assessors to be the total taxable value of land and additions on the property. | Land | Improvement |
|---|---|---|---|---|
| 2023 | $9,613 | $724,148 | $362,074 | $362,074 |
| 2022 | $7,836 | $709,950 | $354,975 | $354,975 |
| 2021 | $7,735 | $696,030 | $348,015 | $348,015 |
| 2020 | $7,661 | $688,894 | $344,447 | $344,447 |
| 2019 | $7,535 | $675,388 | $337,694 | $337,694 |
| 2018 | $7,160 | $662,146 | $331,073 | $331,073 |
| 2017 | $7,083 | $649,164 | $324,582 | $324,582 |
| 2016 | $6,937 | $636,436 | $318,218 | $318,218 |
| 2015 | $6,845 | $626,878 | $313,439 | $313,439 |
| 2014 | $6,743 | $614,600 | $307,300 | $307,300 |
Source: Public Records
Map
Nearby Homes
- 2490 Rosewood Dr
- 2491 Rosewood Dr
- 2321 Bennington Dr
- 2350 Princeton Dr
- 2261 Whitman Way
- 2209 Kingston Ave
- 6329 Shelter Creek Ln
- 7229 Shelter Creek Ln
- 6353 Shelter Creek Ln
- 4108 Shelter Creek Ln Unit 4108
- 1344 Shelter Creek Ln
- 2333 Shelter Creek Ln
- 2131 Shelter Creek Ln
- 7108 Shelter Creek Ln
- 2309 Shelter Creek Ln Unit 2309
- 2352 Shelter Creek Ln
- 5246 Shelter Creek Ln
- 3356 Shelter Creek Ln
- 8351 Shelter Creek Ln
- 5202 Shelter Creek Ln