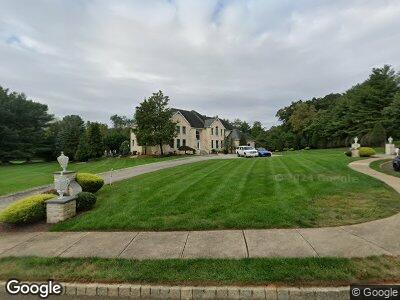
3 Caitlin Dr Marlboro, NJ 07746
Estimated Value: $1,634,000 - $2,066,000
5
Beds
5
Baths
5,782
Sq Ft
$319/Sq Ft
Est. Value
About This Home
This home is located at 3 Caitlin Dr, Marlboro, NJ 07746 and is currently estimated at $1,844,017, approximately $318 per square foot. 3 Caitlin Dr is a home located in Monmouth County with nearby schools including Marlboro Elementary School, Marlboro Middle School, and Marlboro High School.
Ownership History
Date
Name
Owned For
Owner Type
Purchase Details
Closed on
Feb 9, 2022
Sold by
Schwegler Michael and Schwegler Zeynep
Bought by
Schwegler Zeynep and Zeynep Schwegler Living Trust
Current Estimated Value
Home Financials for this Owner
Home Financials are based on the most recent Mortgage that was taken out on this home.
Interest Rate
3.55%
Purchase Details
Closed on
Jan 31, 2022
Sold by
Michael Schwegler
Bought by
Zeynep Schwegler Living Trust
Home Financials for this Owner
Home Financials are based on the most recent Mortgage that was taken out on this home.
Interest Rate
3.55%
Purchase Details
Closed on
Dec 21, 1998
Sold by
Schwartz Allan
Bought by
Schwegler Michael and Schwegler Zeynep
Home Financials for this Owner
Home Financials are based on the most recent Mortgage that was taken out on this home.
Original Mortgage
$400,000
Interest Rate
6.89%
Create a Home Valuation Report for This Property
The Home Valuation Report is an in-depth analysis detailing your home's value as well as a comparison with similar homes in the area
Home Values in the Area
Average Home Value in this Area
Purchase History
| Date | Buyer | Sale Price | Title Company |
|---|---|---|---|
| Zeynep Schwegler Living Trust | -- | Garland Gary B | |
| Schwegler Michael | $638,500 | -- |
Source: Public Records
Mortgage History
| Date | Status | Borrower | Loan Amount |
|---|---|---|---|
| Previous Owner | Schwegler Michael | $484,500 | |
| Previous Owner | Schwegler Zeynep | $522,000 | |
| Previous Owner | Schwegler Michael | $400,000 |
Source: Public Records
Tax History Compared to Growth
Tax History
| Year | Tax Paid | Tax Assessment Tax Assessment Total Assessment is a certain percentage of the fair market value that is determined by local assessors to be the total taxable value of land and additions on the property. | Land | Improvement |
|---|---|---|---|---|
| 2024 | $23,111 | $969,400 | $310,000 | $659,400 |
| 2023 | $23,111 | $969,400 | $310,000 | $659,400 |
| 2022 | $22,519 | $969,400 | $310,000 | $659,400 |
| 2021 | $22,519 | $969,400 | $310,000 | $659,400 |
| 2020 | $22,287 | $969,400 | $310,000 | $659,400 |
| 2019 | $22,296 | $969,400 | $310,000 | $659,400 |
| 2018 | $21,918 | $969,400 | $310,000 | $659,400 |
| 2017 | $21,492 | $969,400 | $310,000 | $659,400 |
| 2016 | $21,404 | $969,400 | $310,000 | $659,400 |
| 2015 | $23,555 | $1,083,000 | $350,000 | $733,000 |
| 2014 | $22,842 | $1,039,200 | $350,000 | $689,200 |
Source: Public Records
Map
Nearby Homes