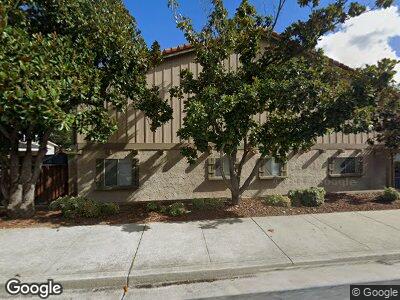
300 Union Ave Unit 24 Campbell, CA 95008
Cambrian NeighborhoodEstimated Value: $787,000 - $816,000
2
Beds
2
Baths
1,127
Sq Ft
$713/Sq Ft
Est. Value
About This Home
This home is located at 300 Union Ave Unit 24, Campbell, CA 95008 and is currently estimated at $804,078, approximately $713 per square foot. 300 Union Ave Unit 24 is a home located in Santa Clara County with nearby schools including Bagby Elementary School, Branham High School, and Fammatre Elementary School.
Ownership History
Date
Name
Owned For
Owner Type
Purchase Details
Closed on
Jan 24, 2019
Sold by
Grinkin Igor and Grinkin Tatlana
Bought by
Shafique Usman and Imam Farheen
Current Estimated Value
Home Financials for this Owner
Home Financials are based on the most recent Mortgage that was taken out on this home.
Original Mortgage
$560,000
Interest Rate
4.6%
Mortgage Type
New Conventional
Purchase Details
Closed on
Oct 27, 2009
Sold by
Bulis Erik Andrew
Bought by
Grinkin Igor and Grinkin Tatiana
Home Financials for this Owner
Home Financials are based on the most recent Mortgage that was taken out on this home.
Original Mortgage
$368,207
Interest Rate
5%
Mortgage Type
FHA
Purchase Details
Closed on
Apr 4, 2005
Sold by
Pacifica Union Station Lp
Bought by
Bulis Erik Andrew
Home Financials for this Owner
Home Financials are based on the most recent Mortgage that was taken out on this home.
Original Mortgage
$444,990
Interest Rate
5.84%
Mortgage Type
New Conventional
Create a Home Valuation Report for This Property
The Home Valuation Report is an in-depth analysis detailing your home's value as well as a comparison with similar homes in the area
Home Values in the Area
Average Home Value in this Area
Purchase History
| Date | Buyer | Sale Price | Title Company |
|---|---|---|---|
| Shafique Usman | $700,000 | Old Republic Title Co | |
| Grinkin Igor | $375,000 | Old Republic Title Company | |
| Bulis Erik Andrew | $445,000 | Chicago Title |
Source: Public Records
Mortgage History
| Date | Status | Borrower | Loan Amount |
|---|---|---|---|
| Open | Shafique Usman | $558,500 | |
| Closed | Shafique Usman | $558,000 | |
| Closed | Shafique Usman | $560,000 | |
| Closed | Shafique Usman | $560,000 | |
| Closed | Shafique Usman | $560,000 | |
| Previous Owner | Grinkin Igor | $415,000 | |
| Previous Owner | Grinkin Igor | $357,393 | |
| Previous Owner | Grinkin Igor | $368,207 | |
| Previous Owner | Bulis Erik Andrew | $416,000 | |
| Previous Owner | Bulis Erik Andrew | $104,000 | |
| Previous Owner | Bulis Erik Andrew | $444,990 |
Source: Public Records
Tax History Compared to Growth
Tax History
| Year | Tax Paid | Tax Assessment Tax Assessment Total Assessment is a certain percentage of the fair market value that is determined by local assessors to be the total taxable value of land and additions on the property. | Land | Improvement |
|---|---|---|---|---|
| 2023 | $10,293 | $750,538 | $375,269 | $375,269 |
| 2022 | $10,131 | $735,822 | $367,911 | $367,911 |
| 2021 | $9,934 | $721,396 | $360,698 | $360,698 |
| 2020 | $9,473 | $714,000 | $357,000 | $357,000 |
| 2019 | $6,174 | $433,635 | $303,518 | $130,117 |
| 2018 | $5,979 | $425,133 | $297,567 | $127,566 |
| 2017 | $5,807 | $416,798 | $291,733 | $125,065 |
| 2016 | $5,502 | $408,626 | $286,013 | $122,613 |
| 2015 | $5,402 | $402,489 | $281,717 | $120,772 |
| 2014 | $5,249 | $394,606 | $276,199 | $118,407 |
Source: Public Records
Map
Nearby Homes
- 300 Union Ave Unit 37
- 858 Apricot Ave Unit B
- 185 Union Ave Unit 46
- 63 Palomar Real Unit 63
- 1965 Deer Cross Ln
- 88 La Paz Way Unit 88
- 1224 Cameo Dr
- 1330 El Moro Dr
- 1910 Shulman Ave
- 912 Campisi Way Unit 215
- 14 Herbert Ln
- 1340 E Campbell Ave
- 2544 New Jersey Ave
- 1585 Dry Creek Rd
- 120 Kennedy Ave
- 106 S 4th St
- 2785 S Bascom Ave Unit 56
- 2857 S Bascom Ave Unit 101
- 250 Watson Dr Unit 2
- 2384 Westpark Dr