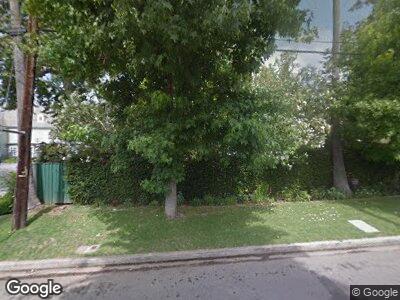
301 S Rockingham Ave Los Angeles, CA 90049
Pacific Palisades NeighborhoodEstimated Value: $3,723,000 - $6,126,000
4
Beds
4
Baths
3,816
Sq Ft
$1,394/Sq Ft
Est. Value
About This Home
This home is located at 301 S Rockingham Ave, Los Angeles, CA 90049 and is currently estimated at $5,318,732, approximately $1,393 per square foot. 301 S Rockingham Ave is a home located in Los Angeles County with nearby schools including Brentwood Science Magnet, Canyon Charter Elementary, and Paul Revere Charter Middle School.
Ownership History
Date
Name
Owned For
Owner Type
Purchase Details
Closed on
Jan 14, 2003
Sold by
Kerlan Rachel
Bought by
Kerlan Rachel and Considine Robert J
Current Estimated Value
Home Financials for this Owner
Home Financials are based on the most recent Mortgage that was taken out on this home.
Original Mortgage
$121,000
Interest Rate
5.96%
Purchase Details
Closed on
Oct 27, 1997
Sold by
Trust Kerlan, Robert And Rachel Trs Kerla
Bought by
Kerlan Rachel and Considine Robert J
Purchase Details
Closed on
Oct 22, 1993
Sold by
Kerlan Robert K
Bought by
Kerlan Robert K and Kerlan Rachel
Home Financials for this Owner
Home Financials are based on the most recent Mortgage that was taken out on this home.
Original Mortgage
$128,000
Interest Rate
7.28%
Purchase Details
Closed on
Sep 3, 1993
Sold by
Kerlan Robert K
Bought by
Kerlan Robert K and Kerlan Rachel
Home Financials for this Owner
Home Financials are based on the most recent Mortgage that was taken out on this home.
Original Mortgage
$128,000
Interest Rate
7.28%
Create a Home Valuation Report for This Property
The Home Valuation Report is an in-depth analysis detailing your home's value as well as a comparison with similar homes in the area
Home Values in the Area
Average Home Value in this Area
Purchase History
| Date | Buyer | Sale Price | Title Company |
|---|---|---|---|
| Kerlan Rachel | -- | Gateway Title Company | |
| Kerlan Rachel | -- | Gateway Title | |
| Kerlan Rachel | -- | -- | |
| Kerlan Robert K | -- | -- | |
| Kerlan Robert K | -- | First American Title Company |
Source: Public Records
Mortgage History
| Date | Status | Borrower | Loan Amount |
|---|---|---|---|
| Open | Kerlan Rachel | $938,250 | |
| Closed | Kerlan Rachel | $121,000 | |
| Previous Owner | Kerlan Robert K | $128,000 |
Source: Public Records
Tax History Compared to Growth
Tax History
| Year | Tax Paid | Tax Assessment Tax Assessment Total Assessment is a certain percentage of the fair market value that is determined by local assessors to be the total taxable value of land and additions on the property. | Land | Improvement |
|---|---|---|---|---|
| 2024 | $7,443 | $584,609 | $317,269 | $267,340 |
| 2023 | $7,308 | $573,148 | $311,049 | $262,099 |
| 2022 | $6,981 | $561,910 | $304,950 | $256,960 |
| 2021 | $6,874 | $550,893 | $298,971 | $251,922 |
| 2019 | $6,673 | $534,554 | $290,104 | $244,450 |
| 2018 | $6,571 | $524,073 | $284,416 | $239,657 |
| 2017 | $6,433 | $513,798 | $278,840 | $234,958 |
| 2016 | $6,250 | $503,724 | $273,373 | $230,351 |
| 2015 | $6,160 | $496,158 | $269,267 | $226,891 |
| 2014 | $6,195 | $486,440 | $263,993 | $222,447 |
Source: Public Records
Map
Nearby Homes
- 222 Avondale Ave
- 250 S Chadbourne Ave
- 137 S Burlingame Ave
- 219 23rd St
- 1443 Jonesboro Dr
- 1401 Jonesboro Dr
- 115 S Rockingham Ave
- 323 22nd St
- 12770 S Bristol Cir
- 351 S Cliffwood Ave
- 1220 Corsica Dr
- 444 25th St
- 13574 D Este Dr
- 239 20th St
- 130 S Cliffwood Ave
- 400 S Cliffwood Ave
- 124 S Cliffwood Ave
- 1480 Capri Dr
- 155 N Anita Ave
- 459 22nd St