302 NE 4th St Delray Beach, FL 33444
Downtown Delray Beach NeighborhoodEstimated payment $160,795/month
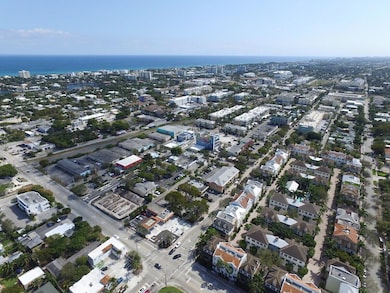
About This Lot
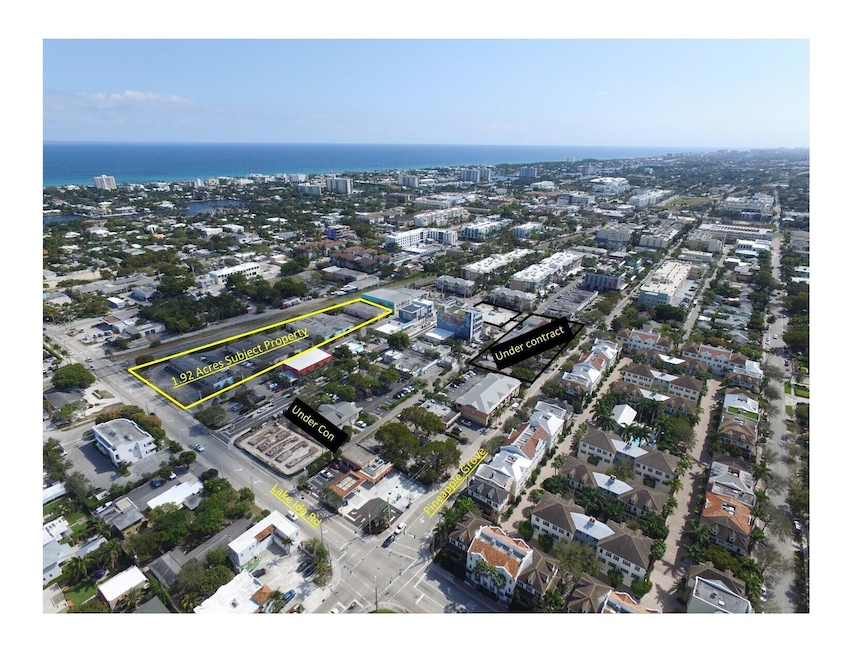
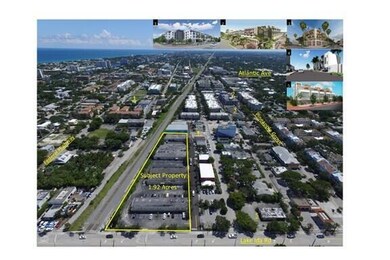
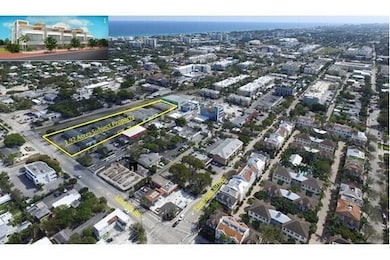
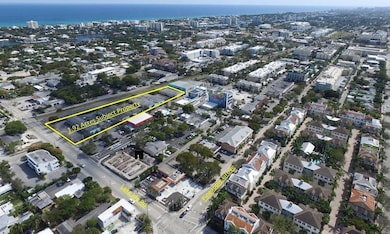
The Last 2 acre parcel available in Downtown Delray Beach. This 3 parcel assemble is situated in the Arts district of Delray Beach. Runs parallel to well known Pine Apple Grove Arts District. One block to Delray's newest chic hotel The Ray part of Hilton Curio Collection. .38 miles from the Intracoastal Waterway and .7 miles away from the Delray's Award Winning Beaches. You can repurpose or redevelop the 4 existing buildings totaling buildings 32,462 SF.
Property Details
Property Type
- Land
Est. Annual Taxes
- $124,621
Year Built
- 1979
Lot Details
- 1.92 Acre Lot
- Corner Lot
- Paved or Partially Paved Lot
- Site Plan Filed
- Property is zoned CBD-RC
Location
- City Lot
Community Details
- Delray Town Of Subdivision
Listing and Financial Details
- Assessor Parcel Number 12434616010890180
Map
Home Values in the Area
Average Home Value in this Area
Tax History
| Year | Tax Paid | Tax Assessment Tax Assessment Total Assessment is a certain percentage of the fair market value that is determined by local assessors to be the total taxable value of land and additions on the property. | Land | Improvement |
|---|---|---|---|---|
| 2024 | $82,870 | $3,717,820 | -- | -- |
| 2023 | $77,501 | $3,379,836 | $2,770,583 | $1,168,830 |
| 2022 | $72,308 | $3,072,578 | $0 | $0 |
| 2021 | $64,302 | $2,793,253 | $1,997,458 | $795,795 |
| 2020 | $64,303 | $2,774,553 | $1,997,458 | $777,095 |
| 2019 | $61,756 | $2,619,772 | $1,902,467 | $717,305 |
| 2018 | $56,938 | $2,551,447 | $1,847,055 | $704,392 |
| 2017 | $52,338 | $2,182,329 | $1,555,959 | $626,370 |
| 2016 | $49,150 | $1,987,056 | $0 | $0 |
| 2015 | $37,054 | $1,341,340 | $0 | $0 |
| 2014 | $35,144 | $1,219,400 | $0 | $0 |
Property History
| Date | Event | Price | Change | Sq Ft Price |
|---|---|---|---|---|
| 03/05/2024 03/05/24 | For Sale | $27,000,000 | 0.0% | -- |
| 03/05/2024 03/05/24 | Price Changed | $27,000,000 | +3.8% | -- |
| 03/01/2024 03/01/24 | Off Market | $26,000,000 | -- | -- |
| 02/14/2024 02/14/24 | Price Changed | $26,000,000 | +13.0% | -- |
| 12/27/2023 12/27/23 | Price Changed | $23,000,000 | +15.0% | -- |
| 06/07/2023 06/07/23 | Price Changed | $20,000,000 | +8.1% | -- |
| 03/21/2023 03/21/23 | For Sale | $18,500,000 | -- | -- |
Deed History
| Date | Type | Sale Price | Title Company |
|---|---|---|---|
| Special Warranty Deed | $4,550,000 | Attorney | |
| Deed | $1,278,000 | -- |
Mortgage History
| Date | Status | Loan Amount | Loan Type |
|---|---|---|---|
| Previous Owner | $5,400,000 | Unknown |
Source: BeachesMLS
MLS Number: R10875431
APN: 12-43-46-16-01-089-0180
Disclaimer: Certain information contained herein is derived from information provided by parties other than Homes.com. All information provided is deemed reliable, but is not guaranteed to be accurate and should be independently verified.
![]() IDX information is provided exclusively for personal, non-commercial use, and may not be used for any purpose other than to identify prospective properties consumers may be interested in purchasing. Information is deemed reliable but not guaranteed.
IDX information is provided exclusively for personal, non-commercial use, and may not be used for any purpose other than to identify prospective properties consumers may be interested in purchasing. Information is deemed reliable but not guaranteed.
- 218 NE 4th St
- 235 SE 5th Ave Unit 2-1
- 373 E Cannery Row Cir
- 147 N Cannery Row Cir
- 137 N Cannery Row Cir
- 135 N Cannery Row Cir
- 260 NE 3rd St Unit 4-F
- 307 NE 5th Ave Unit 307-B
- 105 S Cannery Row Cir
- 112 S Cannery Row Cir
- 226 NE 5th Terrace
- 218 NE 5th Terrace
- 330 NE 1st Ave
- 543 NE 3rd Ave
- 250 NE 3rd Ave Unit 1408
- 250 NE 3rd Ave Unit 1320
- 306 NE 1st Ave
- 414 NE 7th Ave
- 311 N Swinton Ave
- 322 NE 7th Ave
