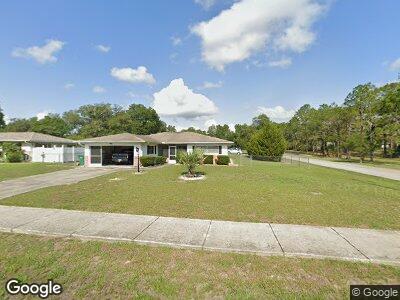
303 Camellia Ave Inverness, FL 34452
Inverness Heights NeighborhoodEstimated Value: $209,539 - $231,000
2
Beds
2
Baths
1,270
Sq Ft
$174/Sq Ft
Est. Value
About This Home
This home is located at 303 Camellia Ave, Inverness, FL 34452 and is currently estimated at $221,135, approximately $174 per square foot. 303 Camellia Ave is a home located in Citrus County with nearby schools including Pleasant Grove Elementary School, Inverness Middle School, and Citrus High School.
Ownership History
Date
Name
Owned For
Owner Type
Purchase Details
Closed on
Mar 10, 2014
Sold by
Wilson Thomas E
Bought by
Bortell Roger S
Current Estimated Value
Home Financials for this Owner
Home Financials are based on the most recent Mortgage that was taken out on this home.
Original Mortgage
$77,634
Outstanding Balance
$59,896
Interest Rate
4.43%
Mortgage Type
VA
Estimated Equity
$161,239
Purchase Details
Closed on
Apr 1, 2013
Sold by
Bradford Pearl L
Bought by
Wilson Thomas E
Purchase Details
Closed on
Sep 18, 2009
Sold by
Russell William W and Russell Marguerite A
Bought by
Bradford John C and Bradford Pearl L
Purchase Details
Closed on
Sep 20, 2002
Sold by
Olson Beatrice May and Estate Of Sophia M Laws
Bought by
Russell William W and Russell Marguerite A
Home Financials for this Owner
Home Financials are based on the most recent Mortgage that was taken out on this home.
Original Mortgage
$60,000
Interest Rate
6.3%
Purchase Details
Closed on
Aug 1, 1994
Bought by
Bortell Roger S
Create a Home Valuation Report for This Property
The Home Valuation Report is an in-depth analysis detailing your home's value as well as a comparison with similar homes in the area
Home Values in the Area
Average Home Value in this Area
Purchase History
| Date | Buyer | Sale Price | Title Company |
|---|---|---|---|
| Bortell Roger S | $76,000 | American Title Services Of C | |
| Wilson Thomas E | -- | Attorney | |
| Bradford John C | $80,000 | First American Title Ins Co | |
| Russell William W | $80,000 | -- | |
| Bortell Roger S | $54,000 | -- |
Source: Public Records
Mortgage History
| Date | Status | Borrower | Loan Amount |
|---|---|---|---|
| Open | Bortell Roger S | $77,634 | |
| Previous Owner | Russell William W | $60,000 |
Source: Public Records
Tax History Compared to Growth
Tax History
| Year | Tax Paid | Tax Assessment Tax Assessment Total Assessment is a certain percentage of the fair market value that is determined by local assessors to be the total taxable value of land and additions on the property. | Land | Improvement |
|---|---|---|---|---|
| 2024 | $664 | $72,262 | -- | -- |
| 2023 | $664 | $70,157 | $0 | $0 |
| 2022 | $640 | $68,114 | $0 | $0 |
| 2021 | $631 | $66,130 | $0 | $0 |
| 2020 | $636 | $107,420 | $7,700 | $99,720 |
| 2019 | $641 | $94,001 | $6,500 | $87,501 |
| 2018 | $646 | $84,610 | $6,500 | $78,110 |
| 2017 | $644 | $61,022 | $6,500 | $54,522 |
| 2016 | $641 | $59,767 | $6,500 | $53,267 |
| 2015 | $638 | $59,352 | $7,420 | $51,932 |
| 2014 | $663 | $52,700 | $7,438 | $45,262 |
Source: Public Records
Map
Nearby Homes
- 329 Camellia Ave
- 522 Hiawatha Ave
- 419 Camellia Ave
- 105 Pleasant Grove Rd
- 1816 Kimberly Ln
- 1824 Kimberly Ln
- 1800 Silverwood St
- 209 Talmage Ave
- 117 Trout Ave
- 204 Trout Ave
- 805 Zephyr St
- 650 Pear Ln Unit 650
- 503 Emery St
- 242 Satellite Ave Unit 242
- 224 N Line Ave Unit 224
- 1863 Arrowwood Ln
- 426 Ella Ave
- 8859 S Pleasant Grove Rd
- 5841 S Pleasant Grove Rd
- 1870 Arrowwood Ln