303 Natchez Trace Dr Lexington, TN 38351
Estimated Value: $89,000 - $125,442
--
Bed
2
Baths
1,344
Sq Ft
$80/Sq Ft
Est. Value
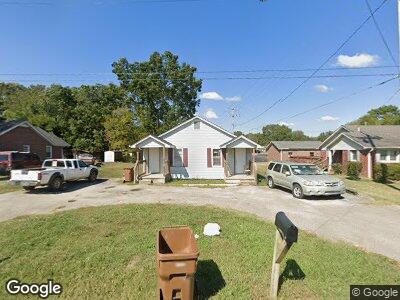
About This Home
This home is located at 303 Natchez Trace Dr, Lexington, TN 38351 and is currently estimated at $107,611, approximately $80 per square foot. 303 Natchez Trace Dr is a home located in Henderson County with nearby schools including Paul G. Caywood Elementary School, Lexington Middle School, and Lexington Montessori Center.
Ownership History
Date
Name
Owned For
Owner Type
Purchase Details
Closed on
Sep 27, 2016
Sold by
Crisman Stephen L
Bought by
Crisman Stephen L and Martiney Sarma
Current Estimated Value
Home Financials for this Owner
Home Financials are based on the most recent Mortgage that was taken out on this home.
Original Mortgage
$23,802
Interest Rate
3.44%
Mortgage Type
New Conventional
Purchase Details
Closed on
Aug 28, 2006
Sold by
Muse Penny D
Bought by
Crisman Stephen L
Home Financials for this Owner
Home Financials are based on the most recent Mortgage that was taken out on this home.
Original Mortgage
$54,260
Interest Rate
6.67%
Purchase Details
Closed on
Feb 6, 1997
Sold by
Jerry Mills
Bought by
Muse Penny D
Purchase Details
Closed on
Mar 24, 1992
Bought by
Mills Jerry
Purchase Details
Closed on
Dec 3, 1991
Bought by
Cogdell Bobby Lee
Purchase Details
Closed on
Apr 24, 1989
Bought by
Cogdell Bobby and Rebecca Fay
Purchase Details
Closed on
Jun 7, 1973
Bought by
Dennison Dennison O and Dennison Hazel
Create a Home Valuation Report for This Property
The Home Valuation Report is an in-depth analysis detailing your home's value as well as a comparison with similar homes in the area
Home Values in the Area
Average Home Value in this Area
Purchase History
| Date | Buyer | Sale Price | Title Company |
|---|---|---|---|
| Crisman Stephen L | -- | -- | |
| Martinez Sarma | -- | -- | |
| Crisman Stephen L | $50,000 | -- | |
| Muse Penny D | $32,000 | -- | |
| Mills Jerry | $66,000 | -- | |
| Cogdell Bobby Lee | -- | -- | |
| Cogdell Bobby | $14,000 | -- | |
| Dennison Dennison O | -- | -- |
Source: Public Records
Mortgage History
| Date | Status | Borrower | Loan Amount |
|---|---|---|---|
| Open | Martinez Sarma | $52,140 | |
| Closed | Martinez Sarma | $70,000 | |
| Closed | Martinez Sarma | $23,802 | |
| Previous Owner | Stephen Crisman | $54,260 |
Source: Public Records
Tax History Compared to Growth
Tax History
| Year | Tax Paid | Tax Assessment Tax Assessment Total Assessment is a certain percentage of the fair market value that is determined by local assessors to be the total taxable value of land and additions on the property. | Land | Improvement |
|---|---|---|---|---|
| 2024 | $648 | $25,920 | $3,600 | $22,320 |
| 2023 | $648 | $25,920 | $3,600 | $22,320 |
| 2022 | $523 | $15,440 | $2,280 | $13,160 |
| 2021 | $523 | $15,440 | $2,280 | $13,160 |
| 2020 | $523 | $15,440 | $2,280 | $13,160 |
| 2019 | $523 | $15,440 | $2,280 | $13,160 |
| 2018 | $539 | $15,440 | $2,280 | $13,160 |
| 2017 | $539 | $15,440 | $2,280 | $13,160 |
| 2016 | $496 | $13,760 | $2,280 | $11,480 |
| 2015 | $496 | $13,760 | $2,280 | $11,480 |
| 2014 | $497 | $13,780 | $0 | $0 |
Source: Public Records
Map
Nearby Homes