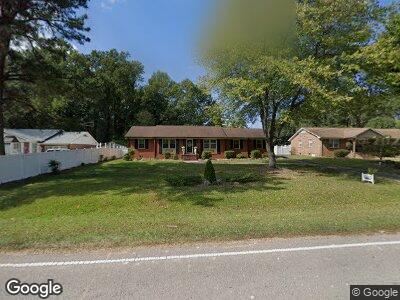
304 Olive Branch Rd Durham, NC 27703
Eastern Durham NeighborhoodEstimated Value: $374,647 - $488,000
3
Beds
2
Baths
1,949
Sq Ft
$215/Sq Ft
Est. Value
About This Home
This home is located at 304 Olive Branch Rd, Durham, NC 27703 and is currently estimated at $418,412, approximately $214 per square foot. 304 Olive Branch Rd is a home located in Durham County with nearby schools including Spring Valley Elementary School, John W Neal Middle School, and Southern School of Energy & Sustainability.
Ownership History
Date
Name
Owned For
Owner Type
Purchase Details
Closed on
Feb 11, 2020
Sold by
Gray Jeff L and Gray Barbara V Andersen
Bought by
Gray Jeffrey L and Gray Barbara V
Current Estimated Value
Purchase Details
Closed on
Sep 19, 2002
Sold by
Gray Jeff L and Gray Barbara V Andersen
Bought by
Gray Jeff L and Gray Barbara V Andersen
Purchase Details
Closed on
May 24, 2002
Sold by
Temple Scott L and Temple Bonnie J
Bought by
Gray Jeff L and Andersen Barbara
Home Financials for this Owner
Home Financials are based on the most recent Mortgage that was taken out on this home.
Original Mortgage
$120,800
Interest Rate
6.92%
Purchase Details
Closed on
May 27, 1998
Sold by
Parker Russell A and Parker Marjorie J
Bought by
Temple Scott L and Temple Bonita J
Home Financials for this Owner
Home Financials are based on the most recent Mortgage that was taken out on this home.
Original Mortgage
$112,800
Interest Rate
6.25%
Create a Home Valuation Report for This Property
The Home Valuation Report is an in-depth analysis detailing your home's value as well as a comparison with similar homes in the area
Home Values in the Area
Average Home Value in this Area
Purchase History
| Date | Buyer | Sale Price | Title Company |
|---|---|---|---|
| Gray Jeffrey L | -- | None Available | |
| Gray Jeff L | -- | -- | |
| Gray Jeff L | $151,000 | -- | |
| Temple Scott L | $142,000 | -- |
Source: Public Records
Mortgage History
| Date | Status | Borrower | Loan Amount |
|---|---|---|---|
| Open | Gray Jeffrey L | $30,000 | |
| Open | Gray Jeff L | $149,500 | |
| Closed | Gray Jeffrey L | $151,800 | |
| Closed | Gray Jeffrey L | $41,602 | |
| Closed | Gray Jeff L | $35,300 | |
| Closed | Gray Jeffrey L | $120,800 | |
| Closed | Gray Jeff L | $120,800 | |
| Previous Owner | Temple Scott L | $112,800 |
Source: Public Records
Tax History Compared to Growth
Tax History
| Year | Tax Paid | Tax Assessment Tax Assessment Total Assessment is a certain percentage of the fair market value that is determined by local assessors to be the total taxable value of land and additions on the property. | Land | Improvement |
|---|---|---|---|---|
| 2024 | $2,179 | $199,172 | $36,700 | $162,472 |
| 2023 | $2,084 | $199,172 | $36,700 | $162,472 |
| 2022 | $2,008 | $199,172 | $36,700 | $162,472 |
| 2021 | $1,747 | $199,172 | $36,700 | $162,472 |
| 2020 | $1,707 | $199,172 | $36,700 | $162,472 |
| 2019 | $1,687 | $199,172 | $36,700 | $162,472 |
| 2018 | $1,615 | $174,959 | $44,040 | $130,919 |
| 2017 | $1,562 | $174,959 | $44,040 | $130,919 |
| 2016 | $1,514 | $174,959 | $44,040 | $130,919 |
| 2015 | $1,774 | $177,067 | $30,187 | $146,880 |
| 2014 | $1,782 | $177,067 | $30,187 | $146,880 |
Source: Public Records
Map
Nearby Homes
- 617 Conover Rd
- 634 Conover Rd
- 609 Conover Rd
- 510 Hester Rd
- 204 Hillview Dr
- 1400 Red Roses Ave
- 1712 Red Roses Ave
- 619 Ashburn Ln
- 6010 Grey Colt Way
- 613 Ashburn Ln
- 506 Hester Rd
- 5255 Wake Forest Rd
- 2020 Rockface Way
- 2018 Rockface Way
- 1012 Red Roses Ave
- 2113 Rockface Way
- 1417 Underbrush Dr
- 1010 Red Roses Ave
- 1004 Red Roses Ave
- 5209 Woodlawn Dr