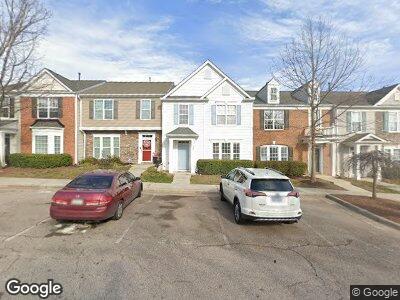
305 Walnut Woods Dr Morrisville, NC 27560
Breckenridge NeighborhoodEstimated Value: $338,000 - $381,124
3
Beds
3
Baths
1,530
Sq Ft
$236/Sq Ft
Est. Value
About This Home
This home is located at 305 Walnut Woods Dr, Morrisville, NC 27560 and is currently estimated at $361,281, approximately $236 per square foot. 305 Walnut Woods Dr is a home located in Wake County with nearby schools including Parkside Elementary School, Alston Ridge Middle School, and Panther Creek High School.
Ownership History
Date
Name
Owned For
Owner Type
Purchase Details
Closed on
Jul 19, 2022
Sold by
Ann Liclion Debra
Bought by
Hunter Debra Ann and Bunter James Alexander
Current Estimated Value
Purchase Details
Closed on
Nov 14, 2019
Sold by
Lichon Debra and Hunter James
Bought by
Lichon Debra and Hunter James
Purchase Details
Closed on
Jul 22, 2016
Sold by
Vega Roberto and Vega Deirdre
Bought by
Lichon Debra and Hunter James
Home Financials for this Owner
Home Financials are based on the most recent Mortgage that was taken out on this home.
Original Mortgage
$185,270
Interest Rate
3.6%
Mortgage Type
New Conventional
Purchase Details
Closed on
Apr 22, 2008
Sold by
Gonzalez Luis Miguel and Gonzalez Jessica H
Bought by
Vega Roberto
Home Financials for this Owner
Home Financials are based on the most recent Mortgage that was taken out on this home.
Original Mortgage
$158,500
Interest Rate
6.08%
Mortgage Type
Unknown
Create a Home Valuation Report for This Property
The Home Valuation Report is an in-depth analysis detailing your home's value as well as a comparison with similar homes in the area
Home Values in the Area
Average Home Value in this Area
Purchase History
| Date | Buyer | Sale Price | Title Company |
|---|---|---|---|
| Hunter Debra Ann | -- | None Listed On Document | |
| Lichon Debra | -- | None Available | |
| Lichon Debra | $191,000 | None Available | |
| Vega Roberto | $158,500 | None Available |
Source: Public Records
Mortgage History
| Date | Status | Borrower | Loan Amount |
|---|---|---|---|
| Previous Owner | Lichon Debra | $181,438 | |
| Previous Owner | Lichon Debra | $185,270 | |
| Previous Owner | Vega Roberto | $141,000 | |
| Previous Owner | Vega Roberto | $145,700 | |
| Previous Owner | Vega Roberto | $153,525 | |
| Previous Owner | Vega Roberto | $158,500 |
Source: Public Records
Tax History Compared to Growth
Tax History
| Year | Tax Paid | Tax Assessment Tax Assessment Total Assessment is a certain percentage of the fair market value that is determined by local assessors to be the total taxable value of land and additions on the property. | Land | Improvement |
|---|---|---|---|---|
| 2024 | $3,135 | $357,824 | $110,000 | $247,824 |
| 2023 | $2,327 | $220,364 | $68,000 | $152,364 |
| 2022 | $2,245 | $220,364 | $68,000 | $152,364 |
| 2021 | $2,148 | $220,364 | $68,000 | $152,364 |
| 2020 | $2,135 | $220,364 | $68,000 | $152,364 |
| 2019 | $1,862 | $164,687 | $42,000 | $122,687 |
| 2018 | $1,752 | $164,687 | $42,000 | $122,687 |
| 2017 | $1,688 | $164,687 | $42,000 | $122,687 |
| 2016 | $1,651 | $164,687 | $42,000 | $122,687 |
| 2015 | $1,614 | $155,542 | $32,000 | $123,542 |
| 2014 | $1,538 | $155,542 | $32,000 | $123,542 |
Source: Public Records
Map
Nearby Homes
- 602 Walnut Woods Dr Unit Lot 62
- 707 Sutter Gate Ln
- 405 Coral Creek Ln
- 503 Gray Marble Rd
- 308 Apricot Cir
- 208 Chandler Chase Ct
- 301 Coral Creek Ln
- 730 Firebrick Dr
- 211 Kurtner Ct
- 307 King Closer Dr
- 219 Adobe Place
- 1613 Clayfire Dr
- 1018 Salt Glaze Ln
- 4355 Pond Pine Trail
- 706 Canyon Lake Cir
- 209 Oswego Ct
- 614 Canyon Lake Cir
- 610 Canyon Lake Cir
- 203 Canyon Lake Cir
- 1012 Fulbright Dr