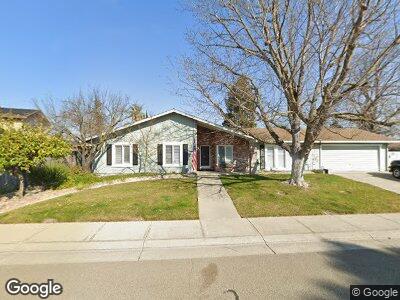
3059 Sleepy Hollow Dr Stockton, CA 95209
Sherwoods Manor NeighborhoodEstimated Value: $496,061 - $532,000
3
Beds
2
Baths
1,975
Sq Ft
$257/Sq Ft
Est. Value
About This Home
This home is located at 3059 Sleepy Hollow Dr, Stockton, CA 95209 and is currently estimated at $508,515, approximately $257 per square foot. 3059 Sleepy Hollow Dr is a home located in San Joaquin County with nearby schools including Creekside Elementary School, Delta Sierra Middle School, and Bear Creek High School.
Ownership History
Date
Name
Owned For
Owner Type
Purchase Details
Closed on
Feb 1, 2017
Sold by
Linger Cindy S
Bought by
Bressington Geoffrey S and Bressington Jessica S
Current Estimated Value
Home Financials for this Owner
Home Financials are based on the most recent Mortgage that was taken out on this home.
Original Mortgage
$160,000
Interest Rate
4.3%
Mortgage Type
New Conventional
Purchase Details
Closed on
Apr 25, 2003
Sold by
Mohan Francis X and Mohan Sandra K
Bought by
Linger Don F and Linger Cindy S
Home Financials for this Owner
Home Financials are based on the most recent Mortgage that was taken out on this home.
Original Mortgage
$175,000
Interest Rate
5.72%
Purchase Details
Closed on
Apr 1, 2000
Sold by
Mohan Francis X and Mohan Sandra
Bought by
Mohan Francis X and Mohan Sandra K
Create a Home Valuation Report for This Property
The Home Valuation Report is an in-depth analysis detailing your home's value as well as a comparison with similar homes in the area
Home Values in the Area
Average Home Value in this Area
Purchase History
| Date | Buyer | Sale Price | Title Company |
|---|---|---|---|
| Bressington Geoffrey S | $200,000 | Old Republic Title Company | |
| Linger Don F | $265,000 | Chicago Title Co | |
| Mohan Francis X | -- | -- |
Source: Public Records
Mortgage History
| Date | Status | Borrower | Loan Amount |
|---|---|---|---|
| Open | Bressington Geoffrey S | $157,500 | |
| Closed | Bressington Geoffrey S | $160,000 | |
| Previous Owner | Linger Don F | $236,000 | |
| Previous Owner | Linger Don F | $175,000 | |
| Previous Owner | Mohan Francis X | $82,600 | |
| Previous Owner | Mohan Francis X | $185,000 | |
| Previous Owner | Mohan Francis Xavier | $25,000 |
Source: Public Records
Tax History Compared to Growth
Tax History
| Year | Tax Paid | Tax Assessment Tax Assessment Total Assessment is a certain percentage of the fair market value that is determined by local assessors to be the total taxable value of land and additions on the property. | Land | Improvement |
|---|---|---|---|---|
| 2024 | $2,664 | $227,562 | $79,646 | $147,916 |
| 2023 | $2,632 | $223,101 | $78,085 | $145,016 |
| 2022 | $2,489 | $218,727 | $76,554 | $142,173 |
| 2021 | $2,547 | $214,439 | $75,053 | $139,386 |
| 2020 | $2,485 | $212,241 | $74,284 | $137,957 |
| 2019 | $2,428 | $208,080 | $72,828 | $135,252 |
| 2018 | $2,385 | $204,000 | $71,400 | $132,600 |
| 2017 | $3,568 | $308,000 | $92,000 | $216,000 |
| 2016 | $3,196 | $287,000 | $84,000 | $203,000 |
| 2014 | $2,310 | $209,000 | $63,000 | $146,000 |
Source: Public Records
Map
Nearby Homes
- 9818 Lady Bird Way
- 3124 Estate Dr
- 9738 Fountain Valley Dr
- 3510 Iron Canyon Cir
- 9808 Piedmont Way
- 3729 Hepburn Cir
- 3445 Timberlane Dr
- 3321 Otto Dr
- 2642 Angel Dr
- 10277 Point Reyes Cir
- 3017 White Oak Dr
- 9896 Thornton Rd
- 9547 Colington Place
- 2629 Stanfield Dr
- 3522 Chatsworth Ct
- 10215 River Park Cir
- 3533 Des Moines Dr
- 9721 Spindrift Way
- 2413 Chapel Hill Cir
- 10022 River Oaks Dr