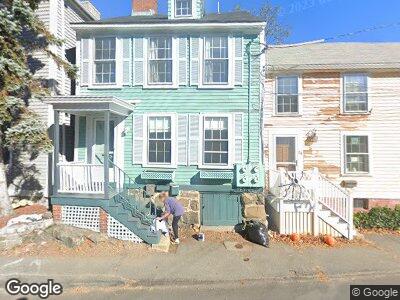
31 Mugford St Marblehead, MA 01945
Estimated Value: $548,052 - $979,000
3
Beds
3
Baths
1,378
Sq Ft
$597/Sq Ft
Est. Value
About This Home
This home is located at 31 Mugford St, Marblehead, MA 01945 and is currently estimated at $823,263, approximately $597 per square foot. 31 Mugford St is a home located in Essex County with nearby schools including Marblehead High School, Marblehead Community Charter Public School, and Devereux School.
Ownership History
Date
Name
Owned For
Owner Type
Purchase Details
Closed on
Feb 13, 2013
Sold by
West Ann M
Bought by
West Props Llc
Current Estimated Value
Purchase Details
Closed on
Sep 19, 2008
Sold by
Condon W Kevin
Bought by
West Ann
Create a Home Valuation Report for This Property
The Home Valuation Report is an in-depth analysis detailing your home's value as well as a comparison with similar homes in the area
Home Values in the Area
Average Home Value in this Area
Purchase History
| Date | Buyer | Sale Price | Title Company |
|---|---|---|---|
| West Props Llc | -- | -- | |
| West Ann | $280,000 | -- |
Source: Public Records
Tax History Compared to Growth
Tax History
| Year | Tax Paid | Tax Assessment Tax Assessment Total Assessment is a certain percentage of the fair market value that is determined by local assessors to be the total taxable value of land and additions on the property. | Land | Improvement |
|---|---|---|---|---|
| 2025 | $7,006 | $774,100 | $566,200 | $207,900 |
| 2024 | $6,544 | $730,400 | $566,200 | $164,200 |
| 2023 | $6,421 | $642,100 | $487,800 | $154,300 |
| 2022 | $6,136 | $583,300 | $435,500 | $147,800 |
| 2021 | $5,987 | $574,600 | $426,800 | $147,800 |
| 2020 | $5,759 | $554,300 | $418,100 | $136,200 |
| 2019 | $5,673 | $528,200 | $392,000 | $136,200 |
| 2018 | $5,340 | $484,600 | $348,400 | $136,200 |
| 2017 | $5,144 | $467,200 | $331,000 | $136,200 |
| 2016 | $4,762 | $429,000 | $296,100 | $132,900 |
| 2015 | $4,561 | $411,600 | $278,700 | $132,900 |
| 2014 | $4,527 | $408,200 | $278,700 | $129,500 |
Source: Public Records
Map
Nearby Homes
- 34 Mugford St
- 22 Mechanic St
- 83 Washington St Unit 1
- 125 Elm St Unit A
- 22 Stacey St
- 3 Lincoln Ave
- 7 Glover Square Unit 2
- 39 Intrepid Cir Unit 203
- 8 Franklin St Unit 19
- 19 Franklin St Unit 4
- 3 Circle St Unit 3
- 3 Doaks Ln
- 218 Washington St Unit 5
- 19 Middle St
- 16 Waldron Ct
- 9 Fort Beach Way
- 23 Gregory St
- 17 Taft St
- 43 Sewall St Unit 2
- 55 Brackett Place Unit B