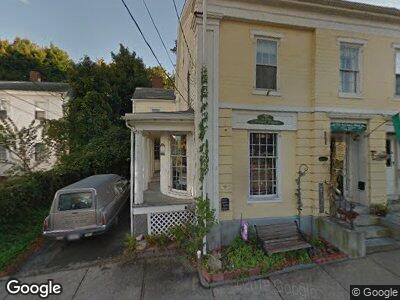
31 North St Plymouth, MA 02360
Plymouth Center NeighborhoodEstimated Value: $505,757
3
Beds
3
Baths
3,029
Sq Ft
$167/Sq Ft
Est. Value
About This Home
This home is located at 31 North St, Plymouth, MA 02360 and is currently estimated at $505,757, approximately $166 per square foot. 31 North St is a home located in Plymouth County with nearby schools including Nathaniel Morton Elementary School, Plymouth Community Intermediate, and Plymouth North High School.
Ownership History
Date
Name
Owned For
Owner Type
Purchase Details
Closed on
Apr 25, 1996
Sold by
Ryan Rt and Ryan
Bought by
Diane Millman Trask T and Diane Trask
Current Estimated Value
Create a Home Valuation Report for This Property
The Home Valuation Report is an in-depth analysis detailing your home's value as well as a comparison with similar homes in the area
Home Values in the Area
Average Home Value in this Area
Purchase History
| Date | Buyer | Sale Price | Title Company |
|---|---|---|---|
| Diane Millman Trask T | $130,000 | -- |
Source: Public Records
Mortgage History
| Date | Status | Borrower | Loan Amount |
|---|---|---|---|
| Previous Owner | Ryan John P | $90,000 |
Source: Public Records
Tax History Compared to Growth
Tax History
| Year | Tax Paid | Tax Assessment Tax Assessment Total Assessment is a certain percentage of the fair market value that is determined by local assessors to be the total taxable value of land and additions on the property. | Land | Improvement |
|---|---|---|---|---|
| 2025 | $7,392 | $582,500 | $228,600 | $353,900 |
| 2024 | $7,057 | $548,300 | $207,800 | $340,500 |
| 2023 | $7,113 | $518,800 | $197,200 | $321,600 |
| 2022 | $7,038 | $456,100 | $188,400 | $267,700 |
| 2021 | $6,912 | $427,700 | $188,400 | $239,300 |
| 2020 | $6,697 | $409,600 | $170,300 | $239,300 |
| 2019 | $6,090 | $368,200 | $166,900 | $201,300 |
| 2018 | $5,623 | $341,600 | $154,400 | $187,200 |
| 2017 | $5,447 | $328,500 | $154,400 | $174,100 |
| 2016 | $5,345 | $328,500 | $154,400 | $174,100 |
| 2015 | $5,106 | $328,600 | $154,400 | $174,200 |
| 2014 | $4,972 | $328,600 | $154,400 | $174,200 |
Source: Public Records
Map
Nearby Homes
- 8 Carver St
- 8 North St Unit 5
- 31 Brewster St Unit 31
- 27 Howland St Unit 5
- 25 Bradford St
- 8 Chilton St
- 76 Court St Unit 7
- 97 Court St Unit 15
- 7-9 S Park Ave
- 2 Fremont St
- 100 Sandwich St
- 31 Mayflower St Unit 3
- 21 Highland Ave
- 126 Summer St
- 26 Davis St
- 129 Court St
- 3 Murray St
- 134 Court St Unit 2
- 134 Court St Unit 11
- 134 Court St Unit 3