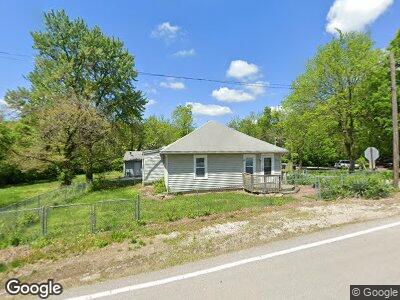
3100 S 35th St Kansas City, KS 66106
Argentine NeighborhoodEstimated Value: $161,000 - $188,727
2
Beds
1
Bath
1,094
Sq Ft
$162/Sq Ft
Est. Value
About This Home
This home is located at 3100 S 35th St, Kansas City, KS 66106 and is currently estimated at $177,682, approximately $162 per square foot. 3100 S 35th St is a home located in Wyandotte County with nearby schools including Junction Elementary School, Turner Sixth Grade Academy, and Turner Middle School.
Ownership History
Date
Name
Owned For
Owner Type
Purchase Details
Closed on
Sep 27, 2018
Sold by
Crable Lynda K
Bought by
Manthe Stephen L and Manthe Wendy J
Current Estimated Value
Home Financials for this Owner
Home Financials are based on the most recent Mortgage that was taken out on this home.
Original Mortgage
$50,000
Outstanding Balance
$44,222
Interest Rate
4.5%
Mortgage Type
Future Advance Clause Open End Mortgage
Estimated Equity
$123,949
Purchase Details
Closed on
Jan 31, 2006
Sold by
Swallow Gary L
Bought by
Crable Lynda K
Purchase Details
Closed on
Feb 25, 2005
Sold by
Crable Lynda K
Bought by
Crable Lynda K and Swallow Gary L
Purchase Details
Closed on
Aug 19, 2004
Sold by
Swallow Vera M
Bought by
Crable Lynda K
Purchase Details
Closed on
Jul 7, 2004
Sold by
Swallow Gary L
Bought by
Crable Lynda K
Purchase Details
Closed on
May 7, 2002
Sold by
Swallow Gary L
Bought by
Swallow Vera M and Crable Lynda K
Create a Home Valuation Report for This Property
The Home Valuation Report is an in-depth analysis detailing your home's value as well as a comparison with similar homes in the area
Home Values in the Area
Average Home Value in this Area
Purchase History
| Date | Buyer | Sale Price | Title Company |
|---|---|---|---|
| Manthe Stephen L | -- | Thomson Affinity Title Llc | |
| Crable Lynda K | -- | None Available | |
| Crable Lynda K | -- | -- | |
| Crable Lynda K | -- | None Available | |
| Crable Lynda K | -- | -- | |
| Crable Lynda K | -- | -- |
Source: Public Records
Mortgage History
| Date | Status | Borrower | Loan Amount |
|---|---|---|---|
| Open | Manthe Stephen L | $50,000 |
Source: Public Records
Tax History Compared to Growth
Tax History
| Year | Tax Paid | Tax Assessment Tax Assessment Total Assessment is a certain percentage of the fair market value that is determined by local assessors to be the total taxable value of land and additions on the property. | Land | Improvement |
|---|---|---|---|---|
| 2024 | $2,266 | $15,514 | $4,467 | $11,047 |
| 2023 | $2,408 | $14,686 | $4,278 | $10,408 |
| 2022 | $2,139 | $12,960 | $3,458 | $9,502 |
| 2021 | $1,833 | $10,787 | $2,769 | $8,018 |
| 2020 | $1,237 | $7,383 | $2,484 | $4,899 |
| 2019 | $1,280 | $7,508 | $2,484 | $5,024 |
| 2018 | $1,479 | $8,821 | $2,024 | $6,797 |
| 2017 | $1,416 | $8,062 | $2,024 | $6,038 |
| 2016 | $1,482 | $8,556 | $2,024 | $6,532 |
| 2015 | $1,549 | $8,556 | $2,024 | $6,532 |
| 2014 | $1,492 | $8,591 | $1,846 | $6,745 |
Source: Public Records
Map
Nearby Homes
- 3112 S 36th St
- 3115 S 34th St
- 3601 Locust Ave
- 3617 Lust Dr
- 3810 Lust Dr
- 2825 S 36th St
- 2800 Vista St
- 4216 Merriam Dr
- 2918 S 26th St
- 2610 S 40th Terrace
- 4412 Merriam Dr
- 5101 Newton St
- 3105 S 45th St
- 8415 W 47th St
- 4825 Hadley St
- 4829 Hadley St
- 2300 Woodend Ave
- 4600 Locust Ave
- 3136 S 46th St
- 3615 Gibbs Rd