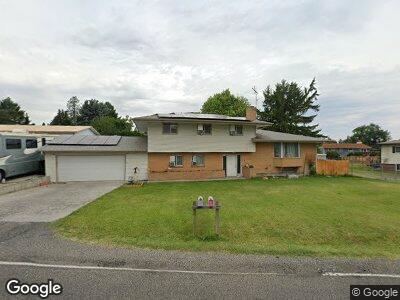
3102 S Cascade St Kennewick, WA 99337
Estimated Value: $432,000 - $573,000
3
Beds
2
Baths
3,237
Sq Ft
$158/Sq Ft
Est. Value
About This Home
This home is located at 3102 S Cascade St, Kennewick, WA 99337 and is currently estimated at $512,155, approximately $158 per square foot. 3102 S Cascade St is a home located in Benton County with nearby schools including Washington Elementary School, Horse Heaven Hills Middle School, and Kennewick High School.
Ownership History
Date
Name
Owned For
Owner Type
Purchase Details
Closed on
Apr 14, 2020
Sold by
Alcorn Merlon L and Alcorn Merlon L
Bought by
Moon Jeremy J and Moon Cassidy P
Current Estimated Value
Home Financials for this Owner
Home Financials are based on the most recent Mortgage that was taken out on this home.
Original Mortgage
$304,385
Outstanding Balance
$274,144
Interest Rate
3.62%
Mortgage Type
FHA
Estimated Equity
$228,375
Purchase Details
Closed on
Sep 27, 2016
Sold by
Alcorn Merlon L and Alcorn Lois M
Bought by
Alcorn Merlon L and Alcorn Lois M
Purchase Details
Closed on
Aug 5, 2005
Sold by
Federal National Mortgage Association
Bought by
Alcorn Merlon L and Alcorn Lois M
Purchase Details
Closed on
Apr 22, 2005
Sold by
Bentley Steven C and Washington Mutual Bank
Bought by
Federal National Mortgage Association
Create a Home Valuation Report for This Property
The Home Valuation Report is an in-depth analysis detailing your home's value as well as a comparison with similar homes in the area
Home Values in the Area
Average Home Value in this Area
Purchase History
| Date | Buyer | Sale Price | Title Company |
|---|---|---|---|
| Moon Jeremy J | $367,407 | Chicago Title Company Of Wa | |
| Alcorn Merlon L | -- | None Available | |
| Alcorn Merlon L | $224,900 | Cascade Title | |
| Federal National Mortgage Association | $202,538 | Frontier Title & Esc |
Source: Public Records
Mortgage History
| Date | Status | Borrower | Loan Amount |
|---|---|---|---|
| Open | Moon Jeremy J | $304,385 | |
| Closed | Moon Jeremy J | $12,175 |
Source: Public Records
Tax History Compared to Growth
Tax History
| Year | Tax Paid | Tax Assessment Tax Assessment Total Assessment is a certain percentage of the fair market value that is determined by local assessors to be the total taxable value of land and additions on the property. | Land | Improvement |
|---|---|---|---|---|
| 2024 | $3,294 | $464,610 | $70,000 | $394,610 |
| 2023 | $3,294 | $412,000 | $70,000 | $342,000 |
| 2022 | $3,129 | $333,070 | $70,000 | $263,070 |
| 2021 | $2,851 | $320,150 | $50,000 | $270,150 |
| 2020 | $3,056 | $282,620 | $50,000 | $232,620 |
| 2019 | $2,759 | $290,130 | $50,000 | $240,130 |
| 2018 | $3,086 | $267,620 | $50,000 | $217,620 |
| 2017 | $2,651 | $245,100 | $50,000 | $195,100 |
| 2016 | $3,036 | $229,300 | $45,000 | $184,300 |
| 2015 | $2,871 | $229,300 | $45,000 | $184,300 |
| 2014 | -- | $214,300 | $30,000 | $184,300 |
| 2013 | -- | $214,300 | $30,000 | $184,300 |
Source: Public Records
Map
Nearby Homes
- 420 W 32nd Ave
- 2804 S Dayton St
- 3303 S Hartford St
- 7254 W 29th Place
- 612 W 27th Ave
- 2836 S Hartford Place
- 14 E 36th Place
- 2634 S Alder St
- 2920 S Jean St
- 2409 S Fruitland St
- NKA W 26th Place
- 2918 S Jean St
- 2601 S Beech St
- 108 E 26th Ave
- 107 E 26th Ave
- 2625 S Beech St
- 106 E 25th Ave
- 3020 S Elm Ct
- 2319 S Garfield St
- 800 W 40th Place