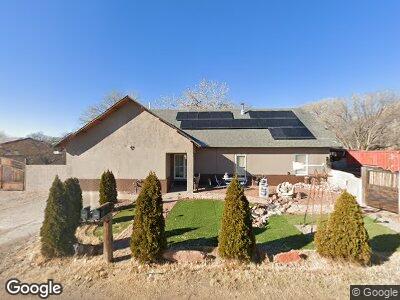
3107 Vega Verde St SW Albuquerque, NM 87105
Near South Valley NeighborhoodEstimated Value: $245,000 - $325,051
4
Beds
2
Baths
1,540
Sq Ft
$186/Sq Ft
Est. Value
About This Home
This home is located at 3107 Vega Verde St SW, Albuquerque, NM 87105 and is currently estimated at $287,013, approximately $186 per square foot. 3107 Vega Verde St SW is a home located in Bernalillo County with nearby schools including Barcelona Elementary School, Harrison Middle School, and Rio Grande High School.
Ownership History
Date
Name
Owned For
Owner Type
Purchase Details
Closed on
Jun 25, 2002
Sold by
Federal National Mortgage Association
Bought by
Vazquez Sergio
Current Estimated Value
Home Financials for this Owner
Home Financials are based on the most recent Mortgage that was taken out on this home.
Original Mortgage
$83,240
Outstanding Balance
$38,080
Interest Rate
6.89%
Estimated Equity
$251,265
Purchase Details
Closed on
Feb 2, 2000
Sold by
Milligan Pat and Milligan Lily R
Bought by
Michaelback Lawrence
Home Financials for this Owner
Home Financials are based on the most recent Mortgage that was taken out on this home.
Original Mortgage
$87,300
Interest Rate
7.95%
Purchase Details
Closed on
Dec 22, 1998
Sold by
Archuleta Steve A and Archuleta Mary T
Bought by
Homeside Lending and Bancboston Mtg Corp
Create a Home Valuation Report for This Property
The Home Valuation Report is an in-depth analysis detailing your home's value as well as a comparison with similar homes in the area
Home Values in the Area
Average Home Value in this Area
Purchase History
| Date | Buyer | Sale Price | Title Company |
|---|---|---|---|
| Vazquez Sergio | -- | Fidelity National Title Ins | |
| Vazquez Sergio | -- | Fidelity National Title Ins | |
| Michaelback Lawrence | -- | Stewart Title | |
| Homeside Lending | -- | -- |
Source: Public Records
Mortgage History
| Date | Status | Borrower | Loan Amount |
|---|---|---|---|
| Open | Vazquez Sergio | $83,240 | |
| Previous Owner | Michaelback Lawrence | $87,300 |
Source: Public Records
Tax History Compared to Growth
Tax History
| Year | Tax Paid | Tax Assessment Tax Assessment Total Assessment is a certain percentage of the fair market value that is determined by local assessors to be the total taxable value of land and additions on the property. | Land | Improvement |
|---|---|---|---|---|
| 2024 | $1,618 | $43,583 | $11,784 | $31,799 |
| 2023 | $1,589 | $42,314 | $11,441 | $30,873 |
| 2022 | $1,495 | $41,082 | $11,108 | $29,974 |
| 2021 | $1,446 | $39,886 | $10,785 | $29,101 |
| 2020 | $1,420 | $38,725 | $10,471 | $28,254 |
| 2019 | $1,378 | $37,597 | $10,166 | $27,431 |
| 2018 | $1,363 | $37,597 | $10,166 | $27,431 |
| 2017 | $1,313 | $37,411 | $10,785 | $26,626 |
| 2016 | $1,263 | $35,263 | $10,166 | $25,097 |
| 2015 | $35,563 | $35,563 | $10,166 | $25,397 |
| 2014 | $1,251 | $35,563 | $10,166 | $25,397 |
| 2013 | -- | $36,592 | $12,988 | $23,604 |
Source: Public Records
Map
Nearby Homes
- 3021 La Loma Rd SW
- 2918 Blake Rd SW
- 2820 Foothill Dr SW
- 2621 Del Sur Dr SW
- 3604 Barcelona Rd SW
- 2617 Blake Rd SW
- 3931 Anderson Farm Dr SW
- 2333 Shipman Rd SW
- 2528 Coors Blvd SW
- 2700 Viola Rd SW
- 3820 Beall Ct SW
- 2107 Valley Rd SW
- 1812 Van Ct SW
- 1615 Saunders Rd SW
- 1630 Bonaguidi Rd SW
- 2011 Simplicio Ct SW
- 3742 Isleta Blvd SW
- 3740 Isleta Blvd SW
- 1723 Valley Rd SW
- 2503 Sancho Panza Way SW