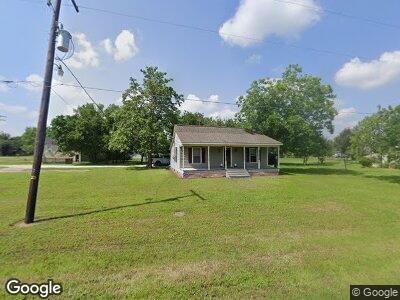
311 E Clay St Bremond, TX 76629
Estimated Value: $115,000 - $169,000
--
Bed
--
Bath
1,087
Sq Ft
$123/Sq Ft
Est. Value
About This Home
This home is located at 311 E Clay St, Bremond, TX 76629 and is currently estimated at $134,196, approximately $123 per square foot. 311 E Clay St is a home located in Robertson County with nearby schools including Bremond Elementary School, Bremond Middle School, and Bremond High School.
Create a Home Valuation Report for This Property
The Home Valuation Report is an in-depth analysis detailing your home's value as well as a comparison with similar homes in the area
Home Values in the Area
Average Home Value in this Area
Tax History Compared to Growth
Tax History
| Year | Tax Paid | Tax Assessment Tax Assessment Total Assessment is a certain percentage of the fair market value that is determined by local assessors to be the total taxable value of land and additions on the property. | Land | Improvement |
|---|---|---|---|---|
| 2024 | $1,975 | $103,994 | $12,075 | $91,919 |
| 2023 | $1,974 | $103,969 | $11,730 | $92,239 |
| 2022 | $1,542 | $69,473 | $6,750 | $62,723 |
| 2021 | $1,556 | $65,278 | $6,750 | $58,528 |
| 2020 | $1,542 | $64,135 | $6,750 | $57,385 |
| 2019 | $1,534 | $63,052 | $5,250 | $57,802 |
| 2018 | $1,534 | $63,052 | $5,250 | $57,802 |
| 2017 | $1,547 | $62,262 | $5,040 | $57,222 |
| 2016 | $1,131 | $45,501 | $5,040 | $40,461 |
| 2015 | -- | $45,501 | $5,040 | $40,461 |
| 2014 | -- | $46,982 | $5,040 | $41,942 |
Source: Public Records
Map
Nearby Homes
- 522 E Colorado St
- 522 E Jack St
- 218 E Denton St
- 404 E Collins St
- 409 S Commerce St
- 3306 Texas 14
- +/-26 AC. Texas 14
- 908 S Main St
- 906 S Main St
- 412 E Hunt St
- 218 N Commerce St
- 418 N Dallas St
- 510 N Dallas St
- 505 N Main St
- 14597 Fm 1373
- TBD W John
- 12628 N Tidwell Prairie Rd
- TBA County Road 276
- TBD County Road 258
- TBD Cr 254 Rd