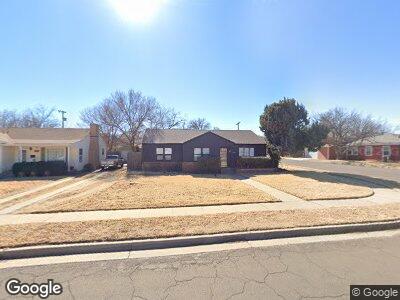
3119 31st St Lubbock, TX 79410
Tech Terrace (UNIT) NeighborhoodEstimated Value: $113,000 - $279,115
3
Beds
2
Baths
1,882
Sq Ft
$119/Sq Ft
Est. Value
About This Home
This home is located at 3119 31st St, Lubbock, TX 79410 and is currently estimated at $224,779, approximately $119 per square foot. 3119 31st St is a home located in Lubbock County with nearby schools including Wilson Elementary School, Hutchinson Middle School, and Lubbock High School.
Ownership History
Date
Name
Owned For
Owner Type
Purchase Details
Closed on
Aug 27, 2021
Sold by
Manawar Tawny Mills and Manawar Abdulrahaman
Bought by
Texas Department Of Hsng & Cmnty Affairs
Current Estimated Value
Purchase Details
Closed on
May 28, 2021
Sold by
K4x Llc
Bought by
Monawar Tawny Mills and Monawar Abdulrahman
Home Financials for this Owner
Home Financials are based on the most recent Mortgage that was taken out on this home.
Original Mortgage
$205,214
Interest Rate
3%
Mortgage Type
FHA
Purchase Details
Closed on
May 31, 2017
Sold by
Machseh Properties Llc
Bought by
K4x Llc
Home Financials for this Owner
Home Financials are based on the most recent Mortgage that was taken out on this home.
Original Mortgage
$171,000
Interest Rate
3.97%
Mortgage Type
Commercial
Purchase Details
Closed on
Jun 21, 2013
Sold by
Buckberry Kathryn I
Bought by
K4x Llc
Create a Home Valuation Report for This Property
The Home Valuation Report is an in-depth analysis detailing your home's value as well as a comparison with similar homes in the area
Home Values in the Area
Average Home Value in this Area
Purchase History
| Date | Buyer | Sale Price | Title Company |
|---|---|---|---|
| Monawar Tawny Mills | -- | Hub City Title | |
| K4x Llc | -- | Joy Title Co | |
| K4x Llc | -- | -- |
Source: Public Records
Mortgage History
| Date | Status | Borrower | Loan Amount |
|---|---|---|---|
| Open | Mills Monawar Tawny | $9,265 | |
| Previous Owner | Monawar Tawny Mills | $205,214 | |
| Previous Owner | Monawar Tawny Mills | $8,209 | |
| Previous Owner | K4x Llc | $171,000 | |
| Previous Owner | Buckberry Kathryn | $35,648 |
Source: Public Records
Tax History Compared to Growth
Tax History
| Year | Tax Paid | Tax Assessment Tax Assessment Total Assessment is a certain percentage of the fair market value that is determined by local assessors to be the total taxable value of land and additions on the property. | Land | Improvement |
|---|---|---|---|---|
| 2024 | $4,880 | $285,787 | $35,150 | $250,637 |
| 2023 | $3,618 | $244,330 | $16,200 | $244,397 |
| 2022 | $4,496 | $222,118 | $16,200 | $205,918 |
| 2021 | $3,735 | $174,407 | $16,200 | $158,207 |
| 2020 | $3,378 | $155,338 | $16,200 | $139,138 |
| 2019 | $3,844 | $171,230 | $16,200 | $155,030 |
| 2018 | $4,003 | $178,077 | $16,200 | $161,877 |
| 2017 | $3,540 | $157,277 | $16,200 | $141,077 |
| 2016 | $3,540 | $157,277 | $16,200 | $141,077 |
| 2015 | $3,166 | $143,886 | $16,200 | $127,686 |
| 2014 | $3,166 | $142,361 | $9,000 | $133,361 |
Source: Public Records