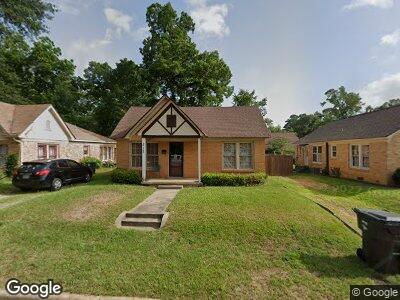
312 E Dobbs St Tyler, TX 75701
Charnwood District NeighborhoodEstimated Value: $165,232 - $194,000
--
Bed
1
Bath
1,189
Sq Ft
$153/Sq Ft
Est. Value
About This Home
This home is located at 312 E Dobbs St, Tyler, TX 75701 and is currently estimated at $182,308, approximately $153 per square foot. 312 E Dobbs St is a home located in Smith County with nearby schools including Bell Elementary School, Hogg Middle School, and Tyler Legacy High School.
Ownership History
Date
Name
Owned For
Owner Type
Purchase Details
Closed on
Jan 15, 2018
Sold by
Linn Estate Holdings Ltd
Bought by
Taylor Stephan
Current Estimated Value
Home Financials for this Owner
Home Financials are based on the most recent Mortgage that was taken out on this home.
Original Mortgage
$60,000
Interest Rate
4.7%
Mortgage Type
Purchase Money Mortgage
Purchase Details
Closed on
Aug 15, 2014
Sold by
Texas Bank And Trust Co
Bought by
J P Pool Home Builder Llc
Home Financials for this Owner
Home Financials are based on the most recent Mortgage that was taken out on this home.
Original Mortgage
$140,000
Interest Rate
4.16%
Mortgage Type
Purchase Money Mortgage
Purchase Details
Closed on
Feb 14, 2007
Sold by
Hefner Howard and Hefner Colleen
Bought by
Creath Md Deborah L
Home Financials for this Owner
Home Financials are based on the most recent Mortgage that was taken out on this home.
Original Mortgage
$59,925
Interest Rate
7.62%
Mortgage Type
Purchase Money Mortgage
Create a Home Valuation Report for This Property
The Home Valuation Report is an in-depth analysis detailing your home's value as well as a comparison with similar homes in the area
Home Values in the Area
Average Home Value in this Area
Purchase History
| Date | Buyer | Sale Price | Title Company |
|---|---|---|---|
| Taylor Stephan | -- | None Available | |
| J P Pool Home Builder Llc | -- | Ctc | |
| Creath Md Deborah L | -- | Smith County Title Company |
Source: Public Records
Mortgage History
| Date | Status | Borrower | Loan Amount |
|---|---|---|---|
| Open | Taylor Stephen | $108,750 | |
| Previous Owner | Taylor Stephan | $60,000 | |
| Previous Owner | J P Pool Home Builder Llc | $140,000 | |
| Previous Owner | Linn Estate Holdings Ltd | $48,000 | |
| Previous Owner | Creath Md Deborah L | $59,925 |
Source: Public Records
Tax History Compared to Growth
Tax History
| Year | Tax Paid | Tax Assessment Tax Assessment Total Assessment is a certain percentage of the fair market value that is determined by local assessors to be the total taxable value of land and additions on the property. | Land | Improvement |
|---|---|---|---|---|
| 2024 | $2,213 | $126,948 | $22,313 | $135,099 |
| 2023 | $1,844 | $105,790 | $22,313 | $83,477 |
| 2022 | $2,027 | $103,441 | $12,750 | $90,691 |
| 2021 | $1,073 | $51,126 | $12,750 | $38,376 |
| 2020 | $1,038 | $48,515 | $12,750 | $35,765 |
| 2019 | $1,899 | $43,315 | $12,750 | $30,565 |
| 2018 | $898 | $41,292 | $12,750 | $28,542 |
| 2017 | $882 | $41,292 | $12,750 | $28,542 |
| 2016 | $832 | $38,952 | $12,750 | $26,202 |
| 2015 | $772 | $37,692 | $12,750 | $24,942 |
| 2014 | $772 | $36,316 | $12,750 | $23,566 |
Source: Public Records
Map
Nearby Homes
- 823 S Donnybrook Ave
- 734 S Donnybrook Ave
- 145 Rowland Place
- 506 E Wells St
- 308 E Ford St
- 520 E Lake St
- 842 S College Ave
- 615 S Fannin Ave
- 419 E Houston St
- 310 W Dobbs St
- 1310 Roseland Blvd
- 514 S Fannin Ave
- 506 S Fannin Ave
- 1401 Belmont Dr
- 502 S Fannin Ave
- 841 S Chilton Ave
- 316 E Reeves St
- 1122 S Chilton Ave
- 314 W 1st St
- 1504 S Wall Ave