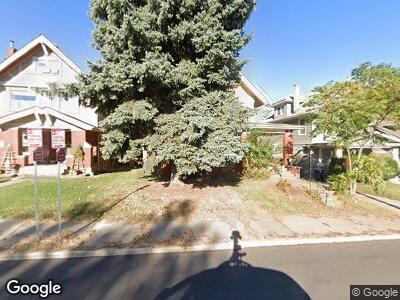
3128 Southwest Trafficway Kansas City, MO 64111
Coleman Highlands NeighborhoodEstimated Value: $220,000 - $248,000
3
Beds
2
Baths
3,254
Sq Ft
$71/Sq Ft
Est. Value
About This Home
This home is located at 3128 Southwest Trafficway, Kansas City, MO 64111 and is currently estimated at $231,795, approximately $71 per square foot. 3128 Southwest Trafficway is a home located in Jackson County with nearby schools including Central Middle School, Central High School, and Citizens Of The World Charter School.
Ownership History
Date
Name
Owned For
Owner Type
Purchase Details
Closed on
Mar 13, 2025
Sold by
Criswell Barbara J
Bought by
Elenique4u Llc
Current Estimated Value
Home Financials for this Owner
Home Financials are based on the most recent Mortgage that was taken out on this home.
Original Mortgage
$444,500
Outstanding Balance
$444,500
Interest Rate
6.87%
Mortgage Type
Credit Line Revolving
Estimated Equity
-$192,529
Purchase Details
Closed on
Feb 20, 2024
Sold by
Kt Mortgage Services Inc
Bought by
Criswell Barbara
Purchase Details
Closed on
Jan 4, 2022
Sold by
Kimberly Matheson
Bought by
Kaffenberger Frank
Home Financials for this Owner
Home Financials are based on the most recent Mortgage that was taken out on this home.
Original Mortgage
$156,200
Interest Rate
3.11%
Mortgage Type
Purchase Money Mortgage
Create a Home Valuation Report for This Property
The Home Valuation Report is an in-depth analysis detailing your home's value as well as a comparison with similar homes in the area
Home Values in the Area
Average Home Value in this Area
Purchase History
| Date | Buyer | Sale Price | Title Company |
|---|---|---|---|
| Elenique4u Llc | -- | Security 1St Title | |
| Criswell Barbara | $170,000 | None Listed On Document | |
| Kaffenberger Frank | -- | None Listed On Document | |
| Kaffenberger Frank | $207,746 | None Listed On Document |
Source: Public Records
Mortgage History
| Date | Status | Borrower | Loan Amount |
|---|---|---|---|
| Open | Elenique4u Llc | $444,500 | |
| Previous Owner | Kaffenberger Frank | $156,200 | |
| Previous Owner | Kaffenberger Frank | $168,000 |
Source: Public Records
Tax History Compared to Growth
Tax History
| Year | Tax Paid | Tax Assessment Tax Assessment Total Assessment is a certain percentage of the fair market value that is determined by local assessors to be the total taxable value of land and additions on the property. | Land | Improvement |
|---|---|---|---|---|
| 2024 | $2,999 | $38,000 | $8,005 | $29,995 |
| 2023 | $4,942 | $63,211 | $7,444 | $55,767 |
| 2022 | $2,344 | $28,500 | $8,702 | $19,798 |
| 2021 | $2,336 | $28,500 | $8,702 | $19,798 |
| 2020 | $4,771 | $57,471 | $8,702 | $48,769 |
| 2019 | $4,672 | $57,471 | $8,702 | $48,769 |
| 2018 | $2,422 | $30,420 | $5,338 | $25,082 |
| 2017 | $2,422 | $30,420 | $5,338 | $25,082 |
| 2016 | $2,374 | $29,658 | $3,648 | $26,010 |
| 2014 | $2,381 | $29,658 | $3,648 | $26,010 |
Source: Public Records
Map
Nearby Homes
- 3226 Karnes Blvd
- 700 W 31st St Unit 1104
- 700 W 31st St Unit 703
- 3011 Jarboe St
- 940 W 34th St
- 2845 Madison Ave
- 2980 Baltimore Ave Unit 2204
- 2940 Baltimore Unit 1201 Ave Unit 1201
- 3433 Central St
- 3615 Jefferson St
- 2728 Holly St
- 3651 Southwest Trafficway
- 3415 Genessee St
- 2630 Madison Ave
- 2949 Grand Ave
- 2624 Jarboe St
- 210 E 31st St
- 207 E 30th St
- 2004 Grand Ave Unit 201
- 3716 Central St